


使用仪器和跟踪技术 (ITT) API 对 PyTorch 工作负载进行性能分析#
创建于:2022 年 10 月 27 日 | 最后更新:2024 年 10 月 24 日 | 最后验证:未验证
在本实践中,您将学习
什么是 Intel® VTune™ Profiler
什么是仪器和跟踪技术 (ITT) API
如何在 Intel® VTune™ Profiler 中可视化 PyTorch 模型层次结构
一个简短的代码示例,展示了如何使用 PyTorch ITT API
要求#
PyTorch 1.13 或更高版本
Intel® VTune™ Profiler
安装 PyTorch 的说明可在 pytorch.org 上找到。
什么是 Intel® VTune™ Profiler#
Intel® VTune™ Profiler 是一款用于串行和多线程应用程序的性能分析工具。对于熟悉 Intel 架构的用户,Intel® VTune™ Profiler 提供了一套丰富的指标,可帮助用户了解应用程序在 Intel 平台上的执行情况,从而了解性能瓶颈所在。
更详细的信息,包括入门指南,可在 Intel 网站 上找到。
什么是仪器和跟踪技术 (ITT) API#
Intel® VTune™ Profiler 提供的 仪器和跟踪技术 API (ITT API) 允许目标应用程序在执行期间生成和控制跟踪数据的收集。
ITT 功能的优势在于可以在 Intel® VTune™ Profiler GUI 上标记单个 PyTorch 运算符以及自定义区域的时间跨度。当用户发现任何异常时,定位行为异常的运算符将非常有帮助。
注意
ITT API 自 1.13 版本起已集成到 PyTorch 中。用户无需调用原始的 ITT C/C++ API,只需调用 PyTorch 中的 Python API 即可。更详细的信息可在 PyTorch Docs 中找到。
如何在 Intel® VTune™ Profiler 中可视化 PyTorch 模型层次结构#
PyTorch 提供了两种使用方式
隐式调用:默认情况下,当启用 ITT 功能时,所有按照 PyTorch 运算符注册机制注册的运算符都将自动被 ITT 功能标记。
显式调用:如果需要自定义标记,用户可以使用 PyTorch Docs 中提到的 API 来显式标记所需的范围。
要启用显式调用,应该在 torch.autograd.profiler.emit_itt() 作用域下调用预期的标记代码。例如:
with torch.autograd.profiler.emit_itt():
  <code-to-be-profiled...>
启动 Intel® VTune™ Profiler#
要验证该功能,您需要启动一个 Intel® VTune™ Profiler 实例。请查阅 Intel® VTune™ Profiler 用户指南 以了解启动 Intel® VTune™ Profiler 的步骤。
注意
用户还可以通过遵循 Intel® VTune™ Profiler Web Server UI 指南 来使用 web-server-ui,例如:vtune-backend –web-port=8080 –allow-remote-access –enable-server-profiling
一旦您启动了 Intel® VTune™ Profiler GUI,您应该会看到如下的用户界面:
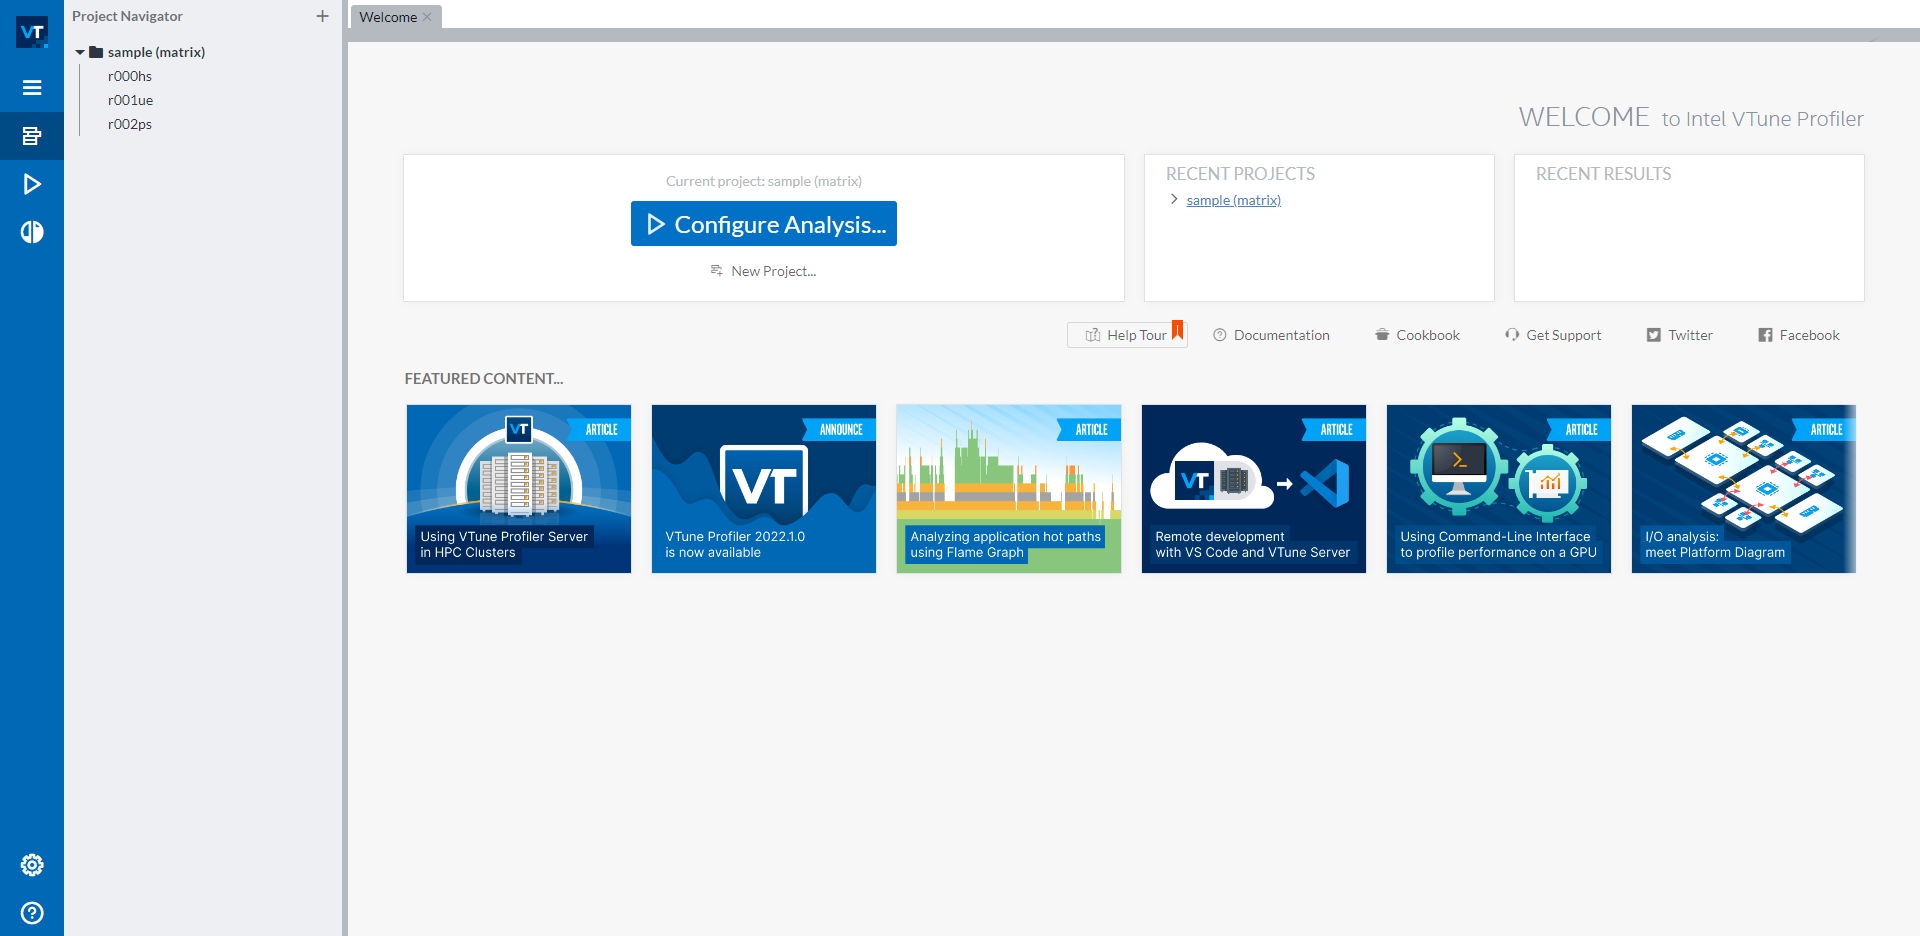
在左侧导航栏的 sample (matrix) 项目下有三个示例结果。如果您不希望分析结果出现在此默认示例项目中,可以通过蓝色 Configure Analysis… 按钮下的 New Project… 按钮创建一个新项目。要开始新的分析,请点击蓝色 Configure Analysis… 按钮来启动分析配置。
配置 CPU 分析#
点击 Configure Analysis… 按钮后,您应该会看到如下屏幕:
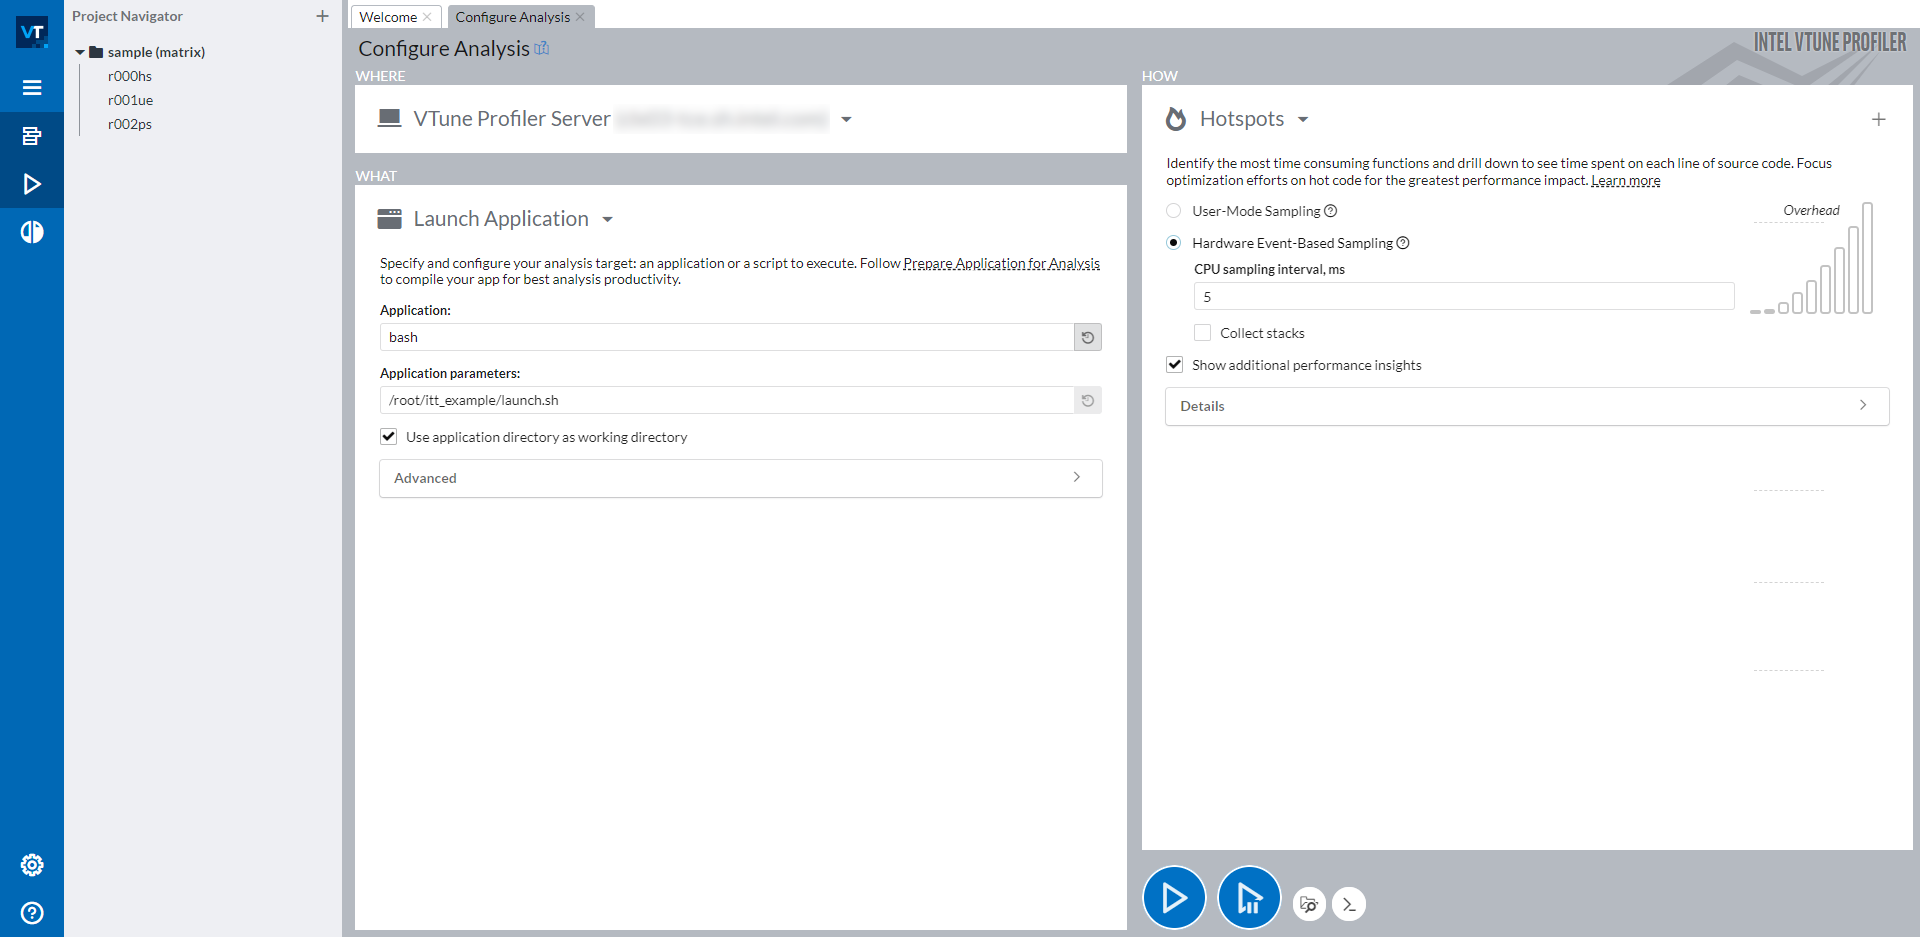
窗口的右侧分为三部分:WHERE(左上角)、WHAT(左下角)和 HOW(右侧)。使用 WHERE,您可以指定要在其上运行分析的机器。使用 WHAT,您可以设置要分析的应用程序的路径。要分析 PyTorch 脚本,建议将所有手动步骤(包括激活 Python 环境和设置必要的环境变量)包装到一个 bash 脚本中,然后分析此 bash 脚本。在上图的截图中,我们将所有步骤包装到 launch.sh bash 脚本中,并以参数 <path_of_launch.sh> 分析 bash。在右侧 HOW 部分,您可以选择任何您想要分析的类型。Intel® VTune™ Profiler 提供了许多可供选择的分析类型。详细信息可在 Intel® VTune™ Profiler 用户指南 中找到。
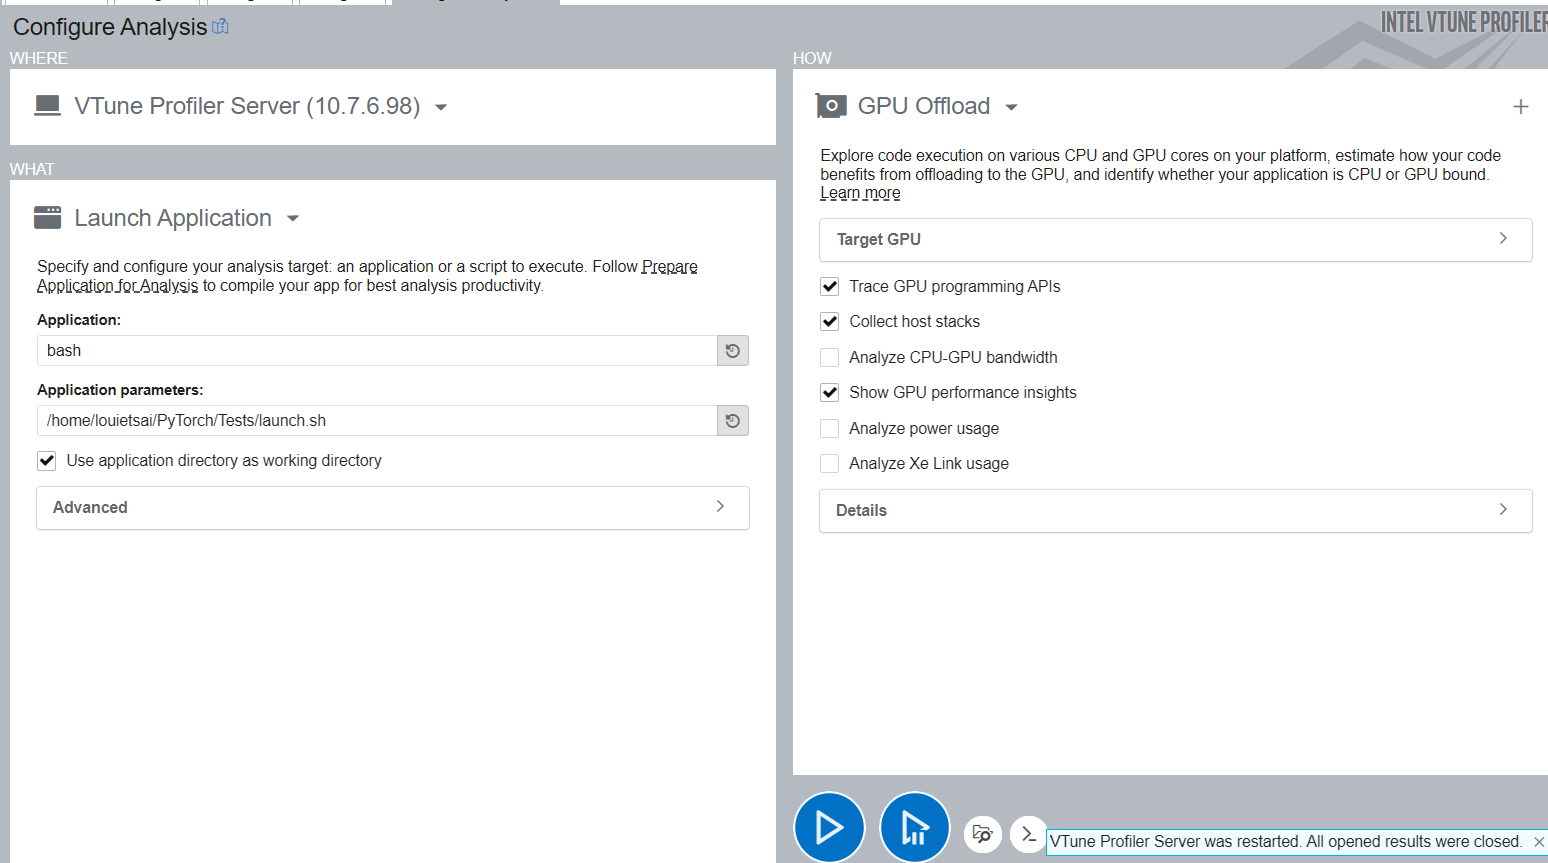
配置 XPU 分析#
选择 GPU Offload Profiling Type 而不是 Hotspots,并按照与 CPU 相同的说明来启动应用程序。
读取分析结果#
通过成功的 ITT 分析,您可以打开分析结果的 Platform 选项卡,在 Intel® VTune™ Profiler 时间线上看到标记。
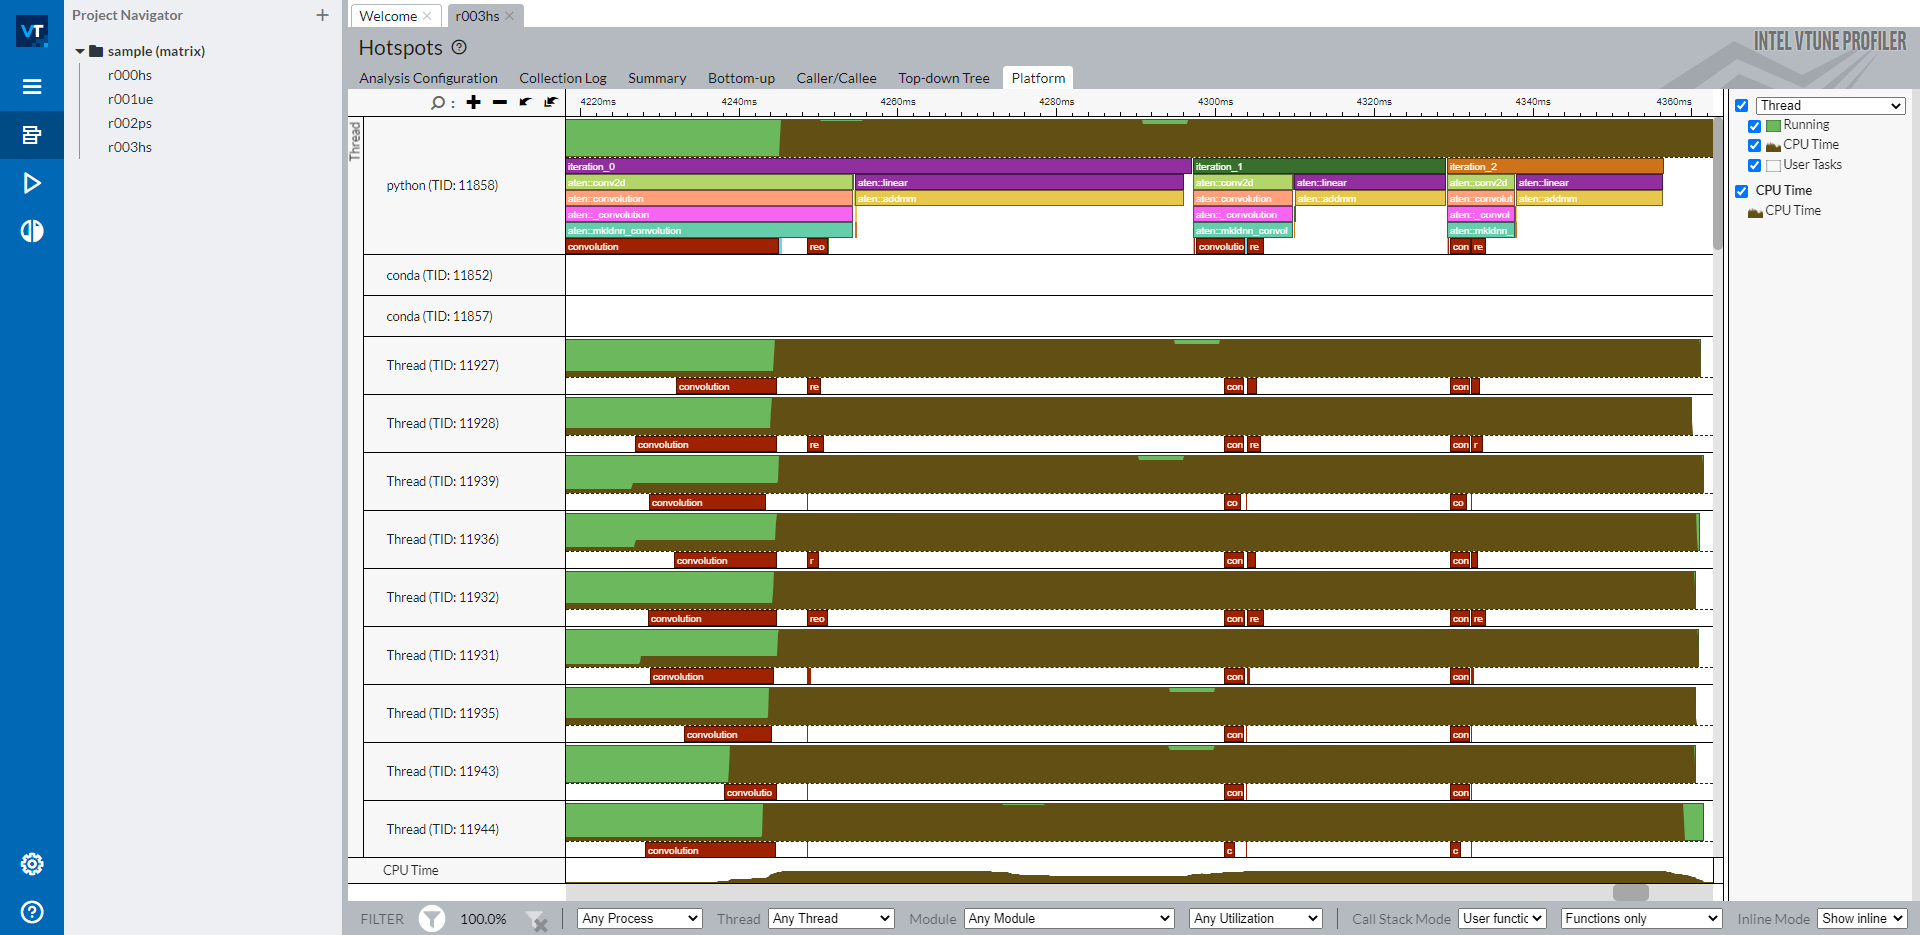
时间线显示主线程作为顶部的 python 线程,以及下面的各个 OpenMP 线程。标记的 PyTorch 运算符和自定义区域显示在主线程行中。所有以 aten:: 开头的运算符都是 PyTorch 中 ITT 功能隐式标记的运算符。标签 iteration_N 是通过特定的 API torch.profiler.itt.range_push()、torch.profiler.itt.range_pop() 或 torch.profiler.itt.range() 作用域显式标记的。请参考下一节的示例代码以获取详细信息。
注意
标记为 convolution 和 reorder 的红色框是从 Intel® oneAPI Deep Neural Network Library (oneDNN) 标记的。
如右侧导航栏所示,时间线行中的棕色部分显示了各个线程的 CPU 使用情况。线程行的高度占棕色部分的比例与该时间戳下该线程的 CPU 使用率相对应。因此,从这条时间线可以直观地理解以下几点:
每个线程的 CPU 核心利用率如何。
所有线程的 CPU 核心利用率如何平衡。所有线程的 CPU 使用率是否良好?
OpenMP 线程的同步情况如何。启动 OpenMP 线程或 OpenMP 线程完成时是否有抖动。
当然,Intel® VTune™ Profiler 提供了更多丰富的分析功能来帮助您理解性能问题。当您了解性能问题的根本原因时,就可以修复它。更详细的使用说明可在 Intel® VTune™ Profiler 用户指南 中找到。
读取 XPU 分析结果#
通过成功的 ITT 分析,您可以打开分析结果的 Platform 选项卡,在 Intel® VTune™ Profiler 时间线上看到标记。
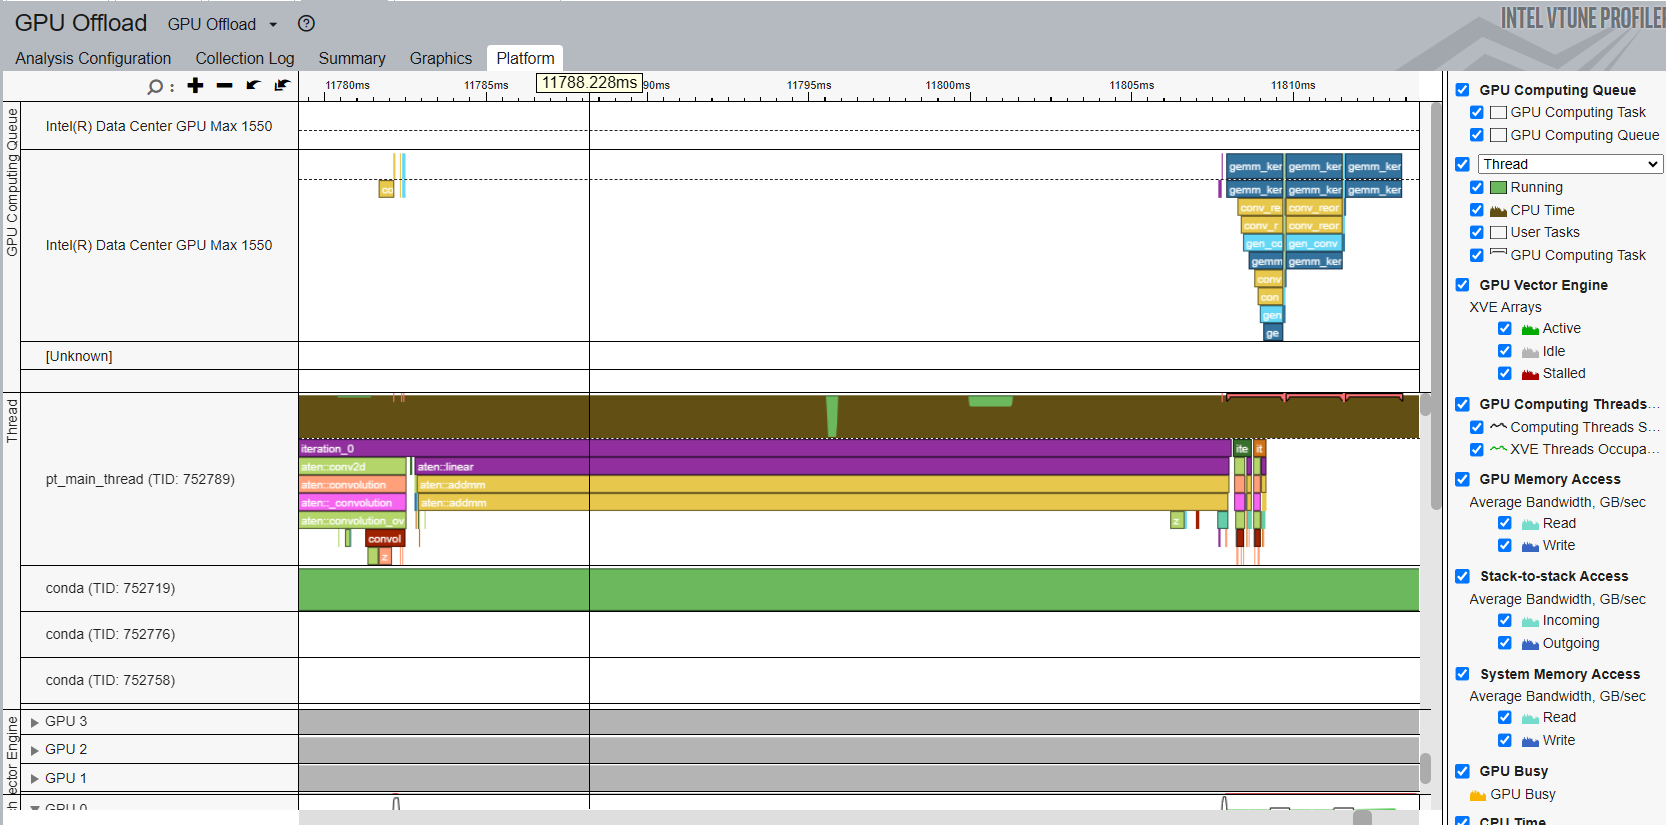
时间线显示顶部的 python 线程为主线程。标记的 PyTorch 运算符和自定义区域显示在主线程行中。所有以 aten:: 开头的运算符都是 PyTorch 中 ITT 功能隐式标记的运算符。时间线还显示顶部的 GPU 计算队列,用户可以看到不同的 XPU 内核被分派到 GPU 队列。
一个简短的代码示例,展示了如何使用 PyTorch ITT API#
下面的示例代码是在上述截图中用于性能分析的脚本。
拓扑由两个运算符 Conv2d 和 Linear 组成。进行了三次推理迭代。每次迭代都通过 PyTorch ITT API 标记为文本字符串 iteration_N。成对的 torch.profile.itt.range_push 和 torch.profile.itt.range_pop 或 torch.profile.itt.range 作用域执行自定义标记功能。
# sample.py

import torch
import torch.nn as nn

class ITTSample(nn.Module):
  def __init__(self):
    super(ITTSample, self).__init__()
    self.conv = nn.Conv2d(3, 5, 3)
    self.linear = nn.Linear(292820, 1000)

  def forward(self, x):
    x = self.conv(x)
    x = x.view(x.shape[0], -1)
    x = self.linear(x)
    return x

def main():
  m = ITTSample
  # unmark below code for XPU
  # m = m.to("xpu")
  x = torch.rand(10, 3, 244, 244)
  # unmark below code for XPU
  # x = x.to("xpu")
  with torch.autograd.profiler.emit_itt():
    for i in range(3)
      # Labeling a region with pair of range_push and range_pop
      #torch.profiler.itt.range_push(f'iteration_{i}')
      #m(x)
      #torch.profiler.itt.range_pop()

      # Labeling a region with range scope
      with torch.profiler.itt.range(f'iteration_{i}'):
        m(x)

if __name__ == '__main__':
  main()
下面显示了在 Intel® VTune™ Profiler GUI 截图中提到的 launch.sh bash 脚本,用于包装所有手动步骤。
# launch.sh

#!/bin/bash

# Retrieve the directory path where the path contains both the sample.py and launch.sh so that this bash script can be invoked from any directory
BASEFOLDER=$( cd -- "$( dirname -- "${BASH_SOURCE[0]}" )" &> /dev/null && pwd )
<Activate a Python environment>
cd ${BASEFOLDER}
python sample.py
