Inspector API
概述
Inspector API 提供了一个便捷的接口,用于分析 ETRecord 和 ETDump 的内容,帮助开发人员深入了解模型架构和性能统计信息。它构建在 EventBlock Class 数据结构之上,该结构组织了一组 Event,方便访问性能分析事件的详细信息。
用户可以通过多种方式与 Inspector API 进行交互:
请参阅 端到端用例文档,以了解如何在实际示例中使用它们。
Inspector 方法
构造函数
- executorch.devtools.Inspector.__init__(self, etdump_path=None, etdump_data=None, etrecord=None, source_time_scale=TimeScale.NS, target_time_scale=TimeScale.MS, debug_buffer_path=None, delegate_metadata_parser=None, delegate_time_scale_converter=None, enable_module_hierarchy=False)
使用提供的 ETDump 路径或二进制文件以及可选的 ETRecord 路径填充底层 EventBlocks 来初始化 Inspector 实例。
- 参数
etdump_path – ETDump 文件的路径。应提供此参数或 etdump_data 参数。
etdump_data – ETDump 二进制文件。应提供此参数或 etdump_path 参数。
etrecord – 可选的 ETRecord 对象或 ETRecord 文件的路径。
source_time_scale – 从运行时检索的性能数据的时间尺度。运行时中的默认时间 hook 实现返回 NS。
target_time_scale – 用户希望将其性能数据转换为的目标时间尺度。默认为 MS。
debug_buffer_path – 包含 ETDump 引用的用于中间输出和程序输出的调试数据的调试缓冲区文件路径。
delegate_metadata_parser – 用于解析 Profile 事件中 delegate 元数据的可选函数。函数的预期签名是:(delegate_metadata_list: List[bytes]) -> Union[List[str], Dict[str, Any]]
delegate_time_scale_converter – 用于转换 delegate 性能数据时间尺度的可选函数。如果未提供,则使用 target_time_scale/source_time_scale 的转换比率。
enable_module_hierarchy – 在算子图中启用子模块。默认为 False。
- 返回
无
示例用法
from executorch.devtools import Inspector

inspector = Inspector(etdump_path="/path/to/etdump.etdp", etrecord="/path/to/etrecord.bin")
to_dataframe
- executorch.devtools.Inspector.to_dataframe(self, include_units=True, include_delegate_debug_data=False)
- 参数
include_units – 标题是否应包含单位(默认为 True)
include_delegate_debug_data – 是否包含 delegate 调试元数据(默认为 False)
- 返回
返回 Inspector 中每个 EventBlock 的事件的 pandas DataFrame,其中每一行代表一个 Event。
print_data_tabular
- executorch.devtools.Inspector.print_data_tabular(*args, **kwargs)
MagicMock 是 Mock 的一个子类,它具有大多数魔术方法的默认实现。您可以直接使用 MagicMock,而无需自己配置魔术方法。
如果您使用 spec 或 spec_set 参数,那么只会创建在 spec 中存在的魔术方法。
MagicMock 的属性和返回值也将是 MagicMocks。
示例用法
inspector.print_data_tabular()
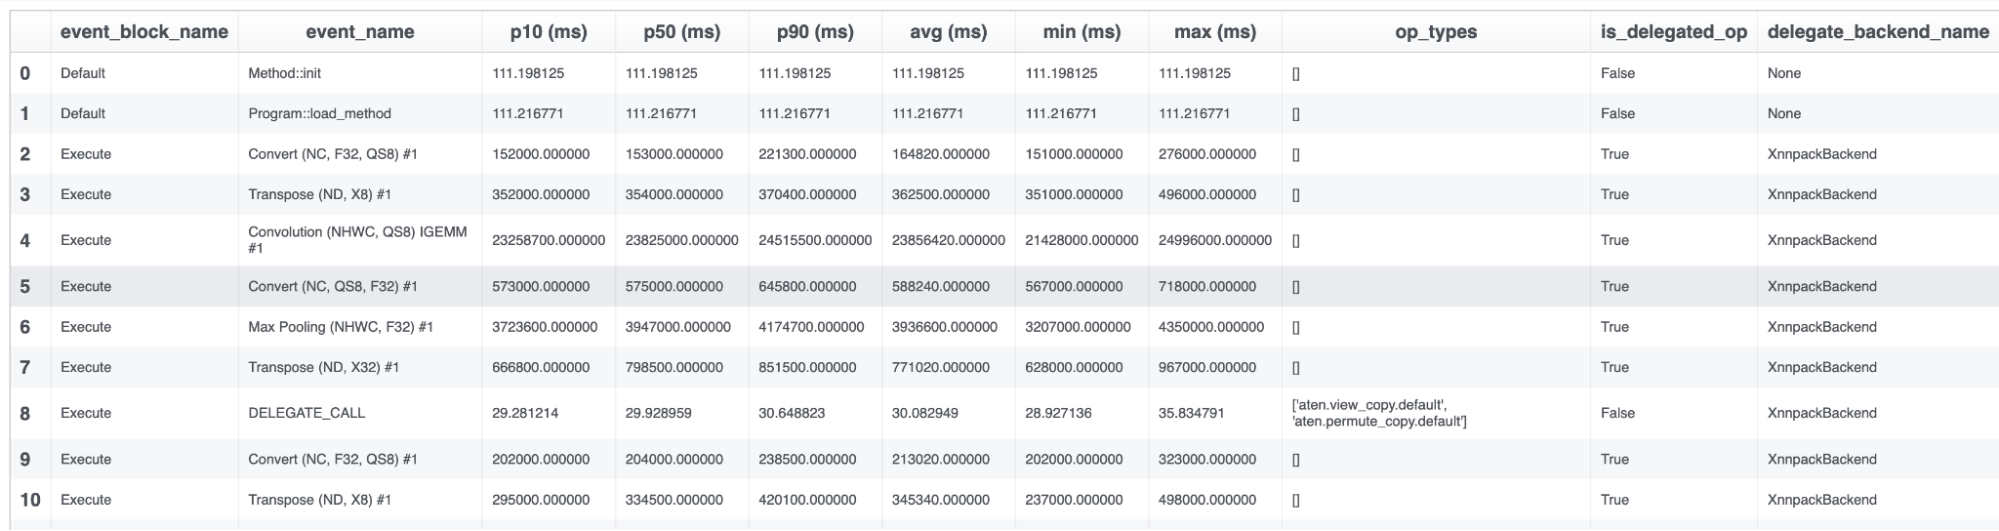
请注意,delegate 性能分析事件的单位是“cycles”。我们正在努力提供一种在未来设置不同单位的方法。
find_total_for_module
- executorch.devtools.Inspector.find_total_for_module(self, module_name)
返回指定模块内所有算子的总平均计算时间。
- 参数
module_name – 要聚合的模块名称。
- 返回
具有“module_name”的模块内所有算子的平均计算时间的总和(以秒为单位)。
示例用法
print(inspector.find_total_for_module("L__self___conv_layer"))
0.002
get_exported_program
- executorch.devtools.Inspector.get_exported_program(self, graph=None)
ETRecord 的辅助访问器,默认返回 Edge Dialect 程序。
- 参数
graph – 要访问的图的可选名称。如果为 None,则返回 Edge Dialect 程序。
- 返回
“graph”的 ExportedProgram 对象。
示例用法
print(inspector.get_exported_program())
ExportedProgram:
    class GraphModule(torch.nn.Module):
        def forward(self, arg0_1: f32[4, 3, 64, 64]):
            # No stacktrace found for following nodes
            _param_constant0 = self._param_constant0
            _param_constant1 = self._param_constant1

            ### ... Omit part of the program for documentation readability ... ###

Graph signature: ExportGraphSignature(parameters=[], buffers=[], user_inputs=['arg0_1'], user_outputs=['aten_tan_default'], inputs_to_parameters={}, inputs_to_buffers={}, buffers_to_mutate={}, backward_signature=None, assertion_dep_token=None)
Range constraints: {}
Equality constraints: []
calculate_numeric_gap
- executorch.devtools.Inspector.calculate_numeric_gap(self, distance='MSE')
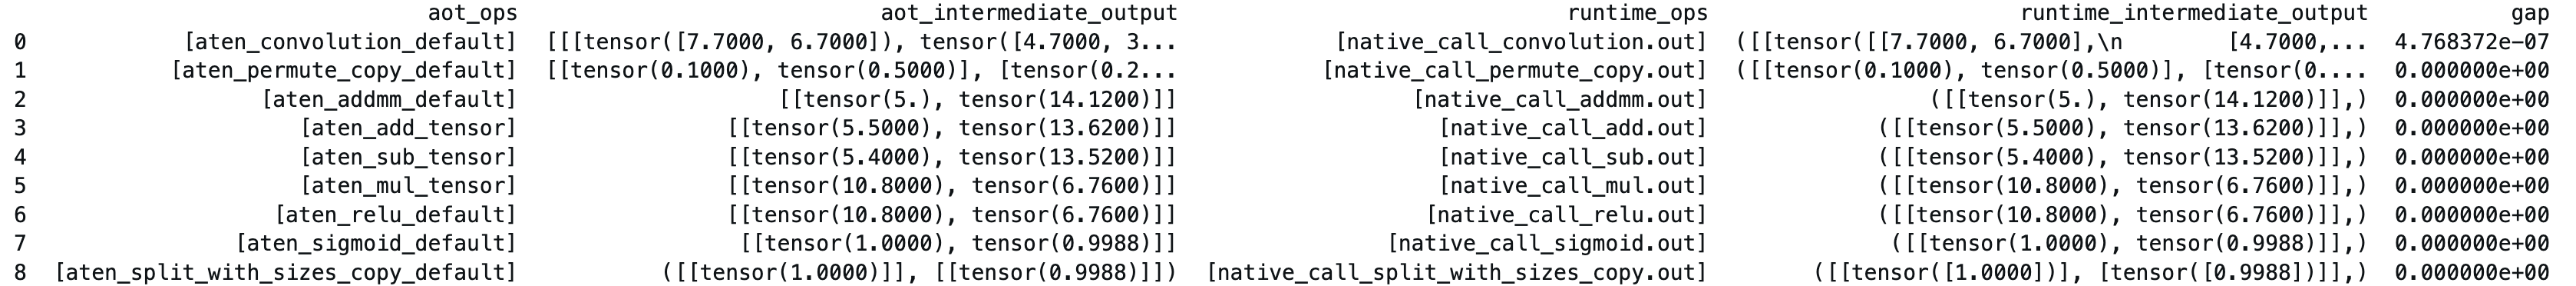
使用用户特定的数值比较器,比较导出的图(在 ETRecord 中)记录的中间输出与运行时输出(在 ETDump 中)。要使用此函数,您必须首先使用 bundle_program 生成 ETRecord,然后使用 ETRecord 和 ETDump 创建 Inspector 实例。然后,Inspector 可以比较 AOT 和运行时的中间输出。
- 参数
distance – 检查器将用于计算差距的度量。应为“MSE”、“L1”和“SNR”之一。
- 返回
一个 DataFrame,列出了两个阶段对应的算子中间输出及其计算出的数值差距。
- 返回类型
pd.DataFrame
示例用法
print(inspector.calculate_numeric_gap("L1"))
Inspector 属性
EventBlock 类
通过 Inspector 实例的 event_blocks 属性访问 EventBlock 实例,例如:
inspector.event_blocks
- class executorch.devtools.inspector.EventBlock(name, events=<factory>, source_time_scale=TimeScale.NS, target_time_scale=TimeScale.MS, bundled_input_index=None, run_output=None, reference_output=None)[source]
EventBlock 包含与从运行时检索到的特定性能分析/调试块关联的一系列事件。每个 EventBlock 代表一个执行模式。例如,模型初始化和加载位于单个 EventBlock 中。如果存在控制流,每个分支将由一个单独的 EventBlock 表示。
- 参数
name – 性能分析/调试块的名称。
events – 与性能分析/调试块关联的 Event 列表。
bundled_input_idx – 此 EventBlock 对应的 Bundled Input 的索引。
run_output – 从封装的 Events 中提取的运行输出
Event 类
通过 EventBlock 实例的 events 属性访问 Event 实例。
- class executorch.devtools.inspector.Event(name, perf_data=None, op_types=<factory>, delegate_debug_identifier=None, debug_handles=None, stack_traces=<factory>, module_hierarchy=<factory>, is_delegated_op=None, delegate_backend_name=None, _delegate_debug_metadatas=<factory>, debug_data=<factory>, _instruction_id=None, _delegate_metadata_parser=None, _delegate_time_scale_converter=None, _start_time=None)[source]
Event 对应于一个算子实例,该实例具有从运行时检索到的性能数据以及来自 ETRecord 的其他元数据。
- 参数
name – 性能分析 Event 的名称,如果没有性能分析事件则为空。
perf_data – 与从运行时检索到的事件关联的性能数据(可用属性:p10、p50、p90、avg、min 和 max)。
op_type – 与事件对应的算子类型列表。
delegate_debug_identifier – 与指令 ID 结合使用的补充标识符。
debug_handles – 与此事件关联的模型图中的调试句柄。
stack_trace – 一个字典,将每个关联算子的名称映射到其堆栈跟踪。
module_hierarchy – 一个字典,将每个关联算子的名称映射到其模块层次结构。
is_delegated_op – 事件是否被委托。
delegate_backend_name – 事件被委托的后端名称。
_delegate_debug_metadatas – 一系列原始的 delegate 调试元数据(字符串格式),每个 profile 事件一个。可作为 Event.delegate_debug_metadatas(如果提供了解析器)或 Event.raw_delegate_debug_metadatas 访问。
debug_data – 一个包含收集到的中间数据的列表。
_instruction_id – 用于符号化的指令标识符
_delegate_metadata_parser – _delegate_debug_metadatas 的可选解析器
示例用法
for event_block in inspector.event_blocks:
    for event in event_block.events:
        if event.name == "Method::execute":
            print(event.perf_data.raw)
[175.748, 78.678, 70.429, 122.006, 97.495, 67.603, 70.2, 90.139, 66.344, 64.575, 134.135, 93.85, 74.593, 83.929, 75.859, 73.909, 66.461, 72.102, 84.142, 77.774, 70.038, 80.246, 59.134, 68.496, 67.496, 100.491, 81.162, 74.53, 70.709, 77.112, 59.775, 79.674, 67.54, 79.52, 66.753, 70.425, 71.703, 81.373, 72.306, 72.404, 94.497, 77.588, 79.835, 68.597, 71.237, 88.528, 71.884, 74.047, 81.513, 76.116]
CLI
在终端中执行以下命令以显示数据表。此命令产生的表输出与调用前面提到的 print_data_tabular 相同。
python3 -m devtools.inspector.inspector_cli --etdump_path <path_to_etdump> --etrecord_path <path_to_etrecord>
请注意,etrecord_path 参数是可选的。
我们计划在未来扩展 CLI 的功能。
