使用 torch.compile 进行性能分析#
创建日期:2023年6月6日 | 最后更新日期:2025年7月11日
torch.profiler 的用途:#
torch.profiler 有助于以内核级别的粒度来理解程序的性能——例如,它可以显示图中断和资源利用率。分析器提供的数据通常可以帮助用户了解在哪里进一步调查以理解模型性能。
要了解内核级别的性能,还可以使用其他工具,例如 Nvidia Nsight compute tool、AMD Omnitrace、Intel® VTune™ Profiler 或 Inductor 的分析工具。
另请参阅 通用的 PyTorch 分析器指南。
使用 torch.profiler 和查看 trace 的基础知识#
示例程序:我们将使用这个 profiling resnet18 的示例。请注意此示例程序的以下部分:
包含一个预热运行,以等待编译完成(这将预热 CUDA 缓存分配器等系统)
使用
torch.profiler.profile()上下文来分析我们感兴趣的部分使用
prof.export_chrome_trace("trace.json")导出分析伪影。
    import torch
    from torchvision.models import resnet18

    device = 'cuda'      # or 'cpu', 'xpu', etc.
    model = resnet18().to(device)

    inputs = [torch.randn((5, 3, 224, 224), device=device) for _ in range(10)]

    model_c = torch.compile(model)

    def fwd_bwd(inp):
        out = model_c(inp)
        out.sum().backward()

    # warm up
    fwd_bwd(inputs[0])

    with torch.profiler.profile() as prof:
        for i in range(1, 4):
            fwd_bwd(inputs[i])
            prof.step()

    prof.export_chrome_trace("trace.json")
查看 Chrome trace:在 Chrome 浏览器中,打开 chrome://tracing 并加载 json 文件。使用“w”和“s”键放大和缩小,使用“a”和“d”键向左和向右滚动。“?”会显示一个包含快捷键列表的“帮助”屏幕。
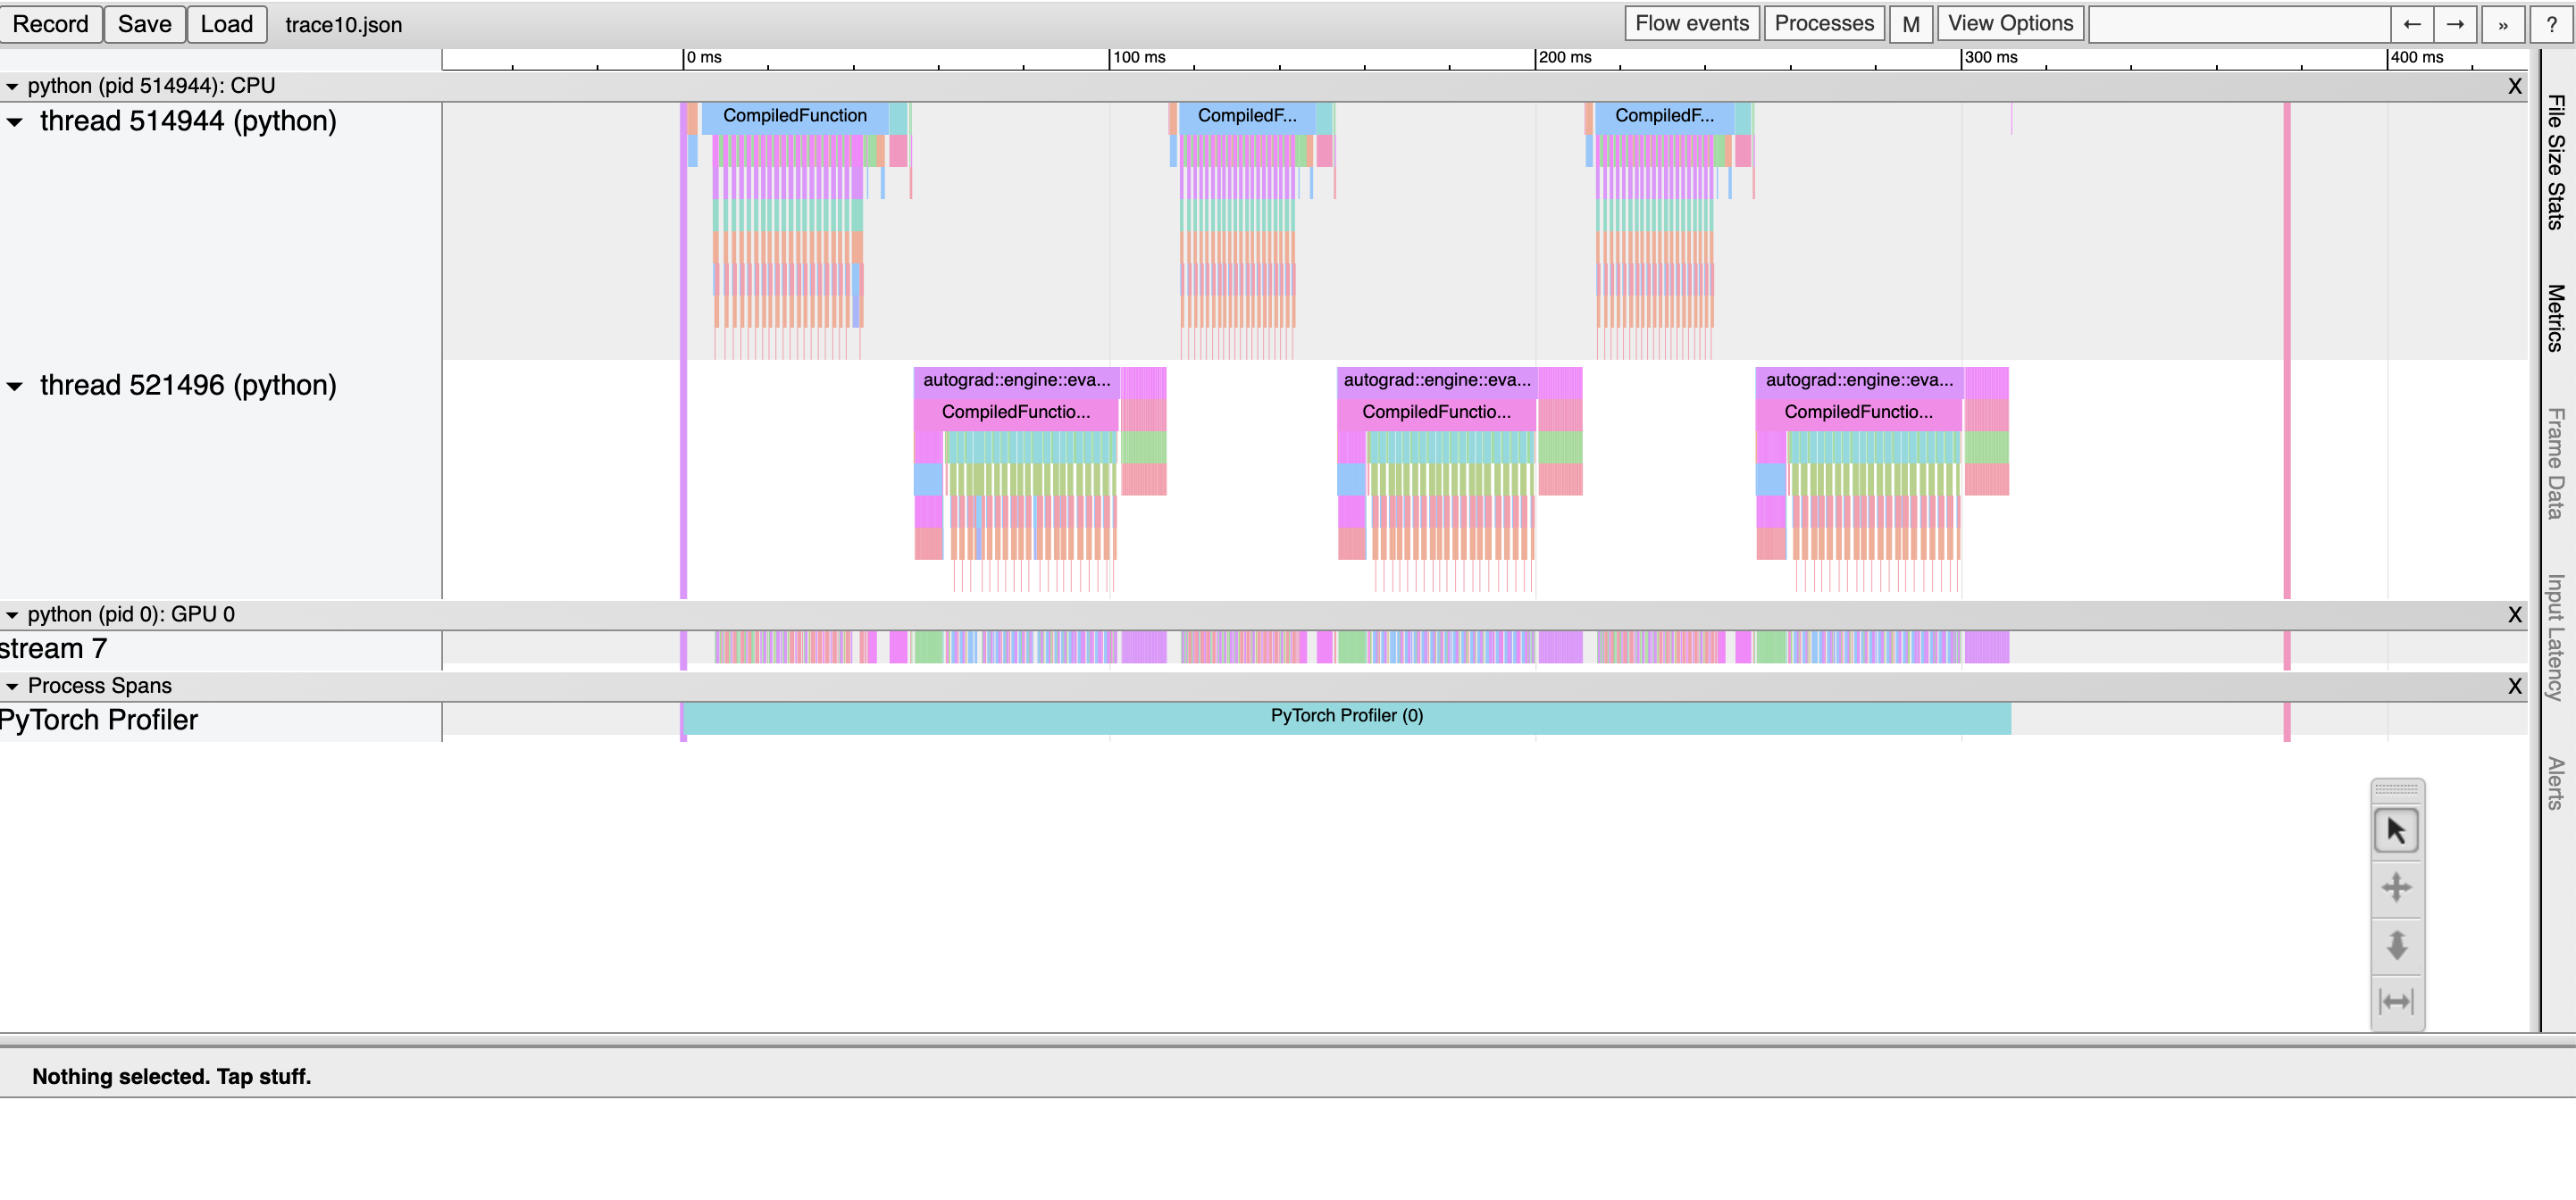
在这里,我们观察到:
CompiledFunction 和 CompiledFunctionBackward 事件,它们对应于 dynamo 编译的区域。
顶部的 CPU 事件,底部的 GPU 事件。
CPU 和加速器事件之间的流。
加速器上的每个内核都在 CPU 上运行的代码启动后执行。分析器可以在加速器和 CPU 事件之间绘制连接(即“流”),以显示哪个 CPU 事件启动了加速器内核。这特别有用,因为除了少数例外,加速器内核是异步启动的。
要查看流连接,请点击 GPU 内核,然后点击“ac2g”。
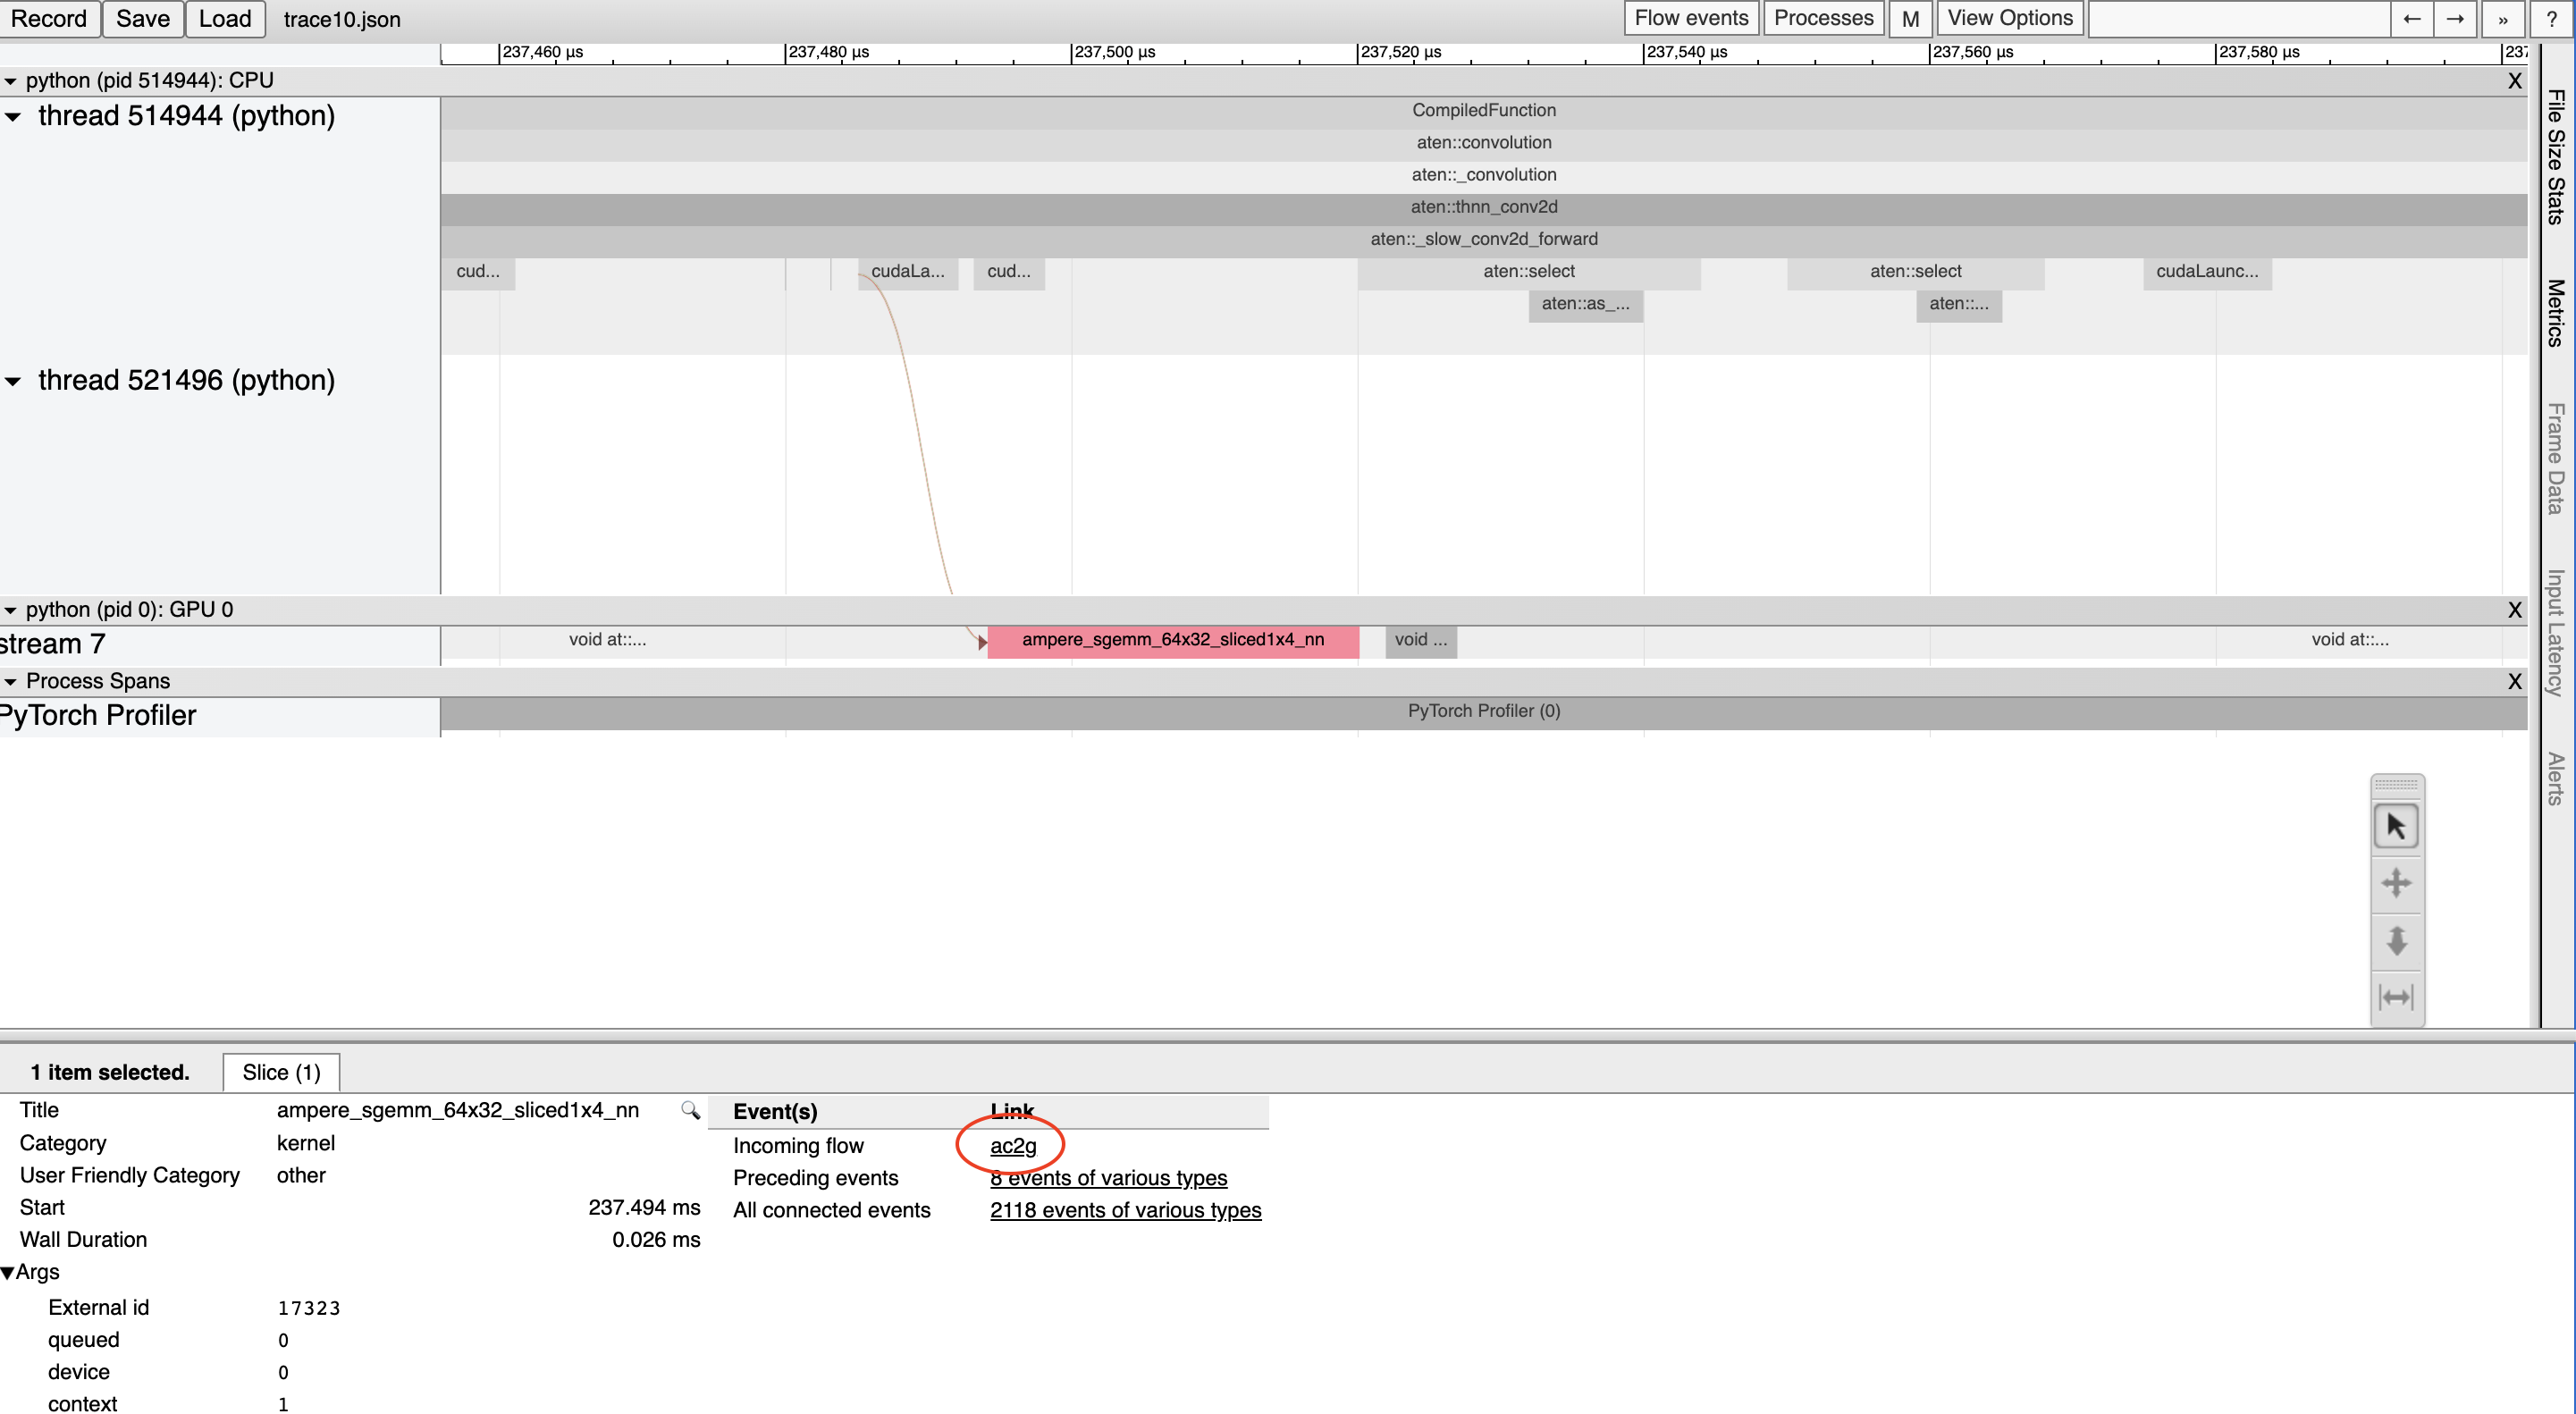
或者,通过顶部的“Flow events”下拉菜单开启 *所有* 流。
解决 CUDA Graph 分析问题#
当启用 CUDA 图时,某些 CUDA 配置(驱动程序版本低于 525.85.12 或 CUDA < 12)可能会遇到分析工具和 CUDA 图之间的兼容性问题。要解决这些问题,请在程序顶部添加一个空的分析上下文。
    import torch

    torch.profiler._utils._init_for_cuda_graphs()

    # ... rest of program
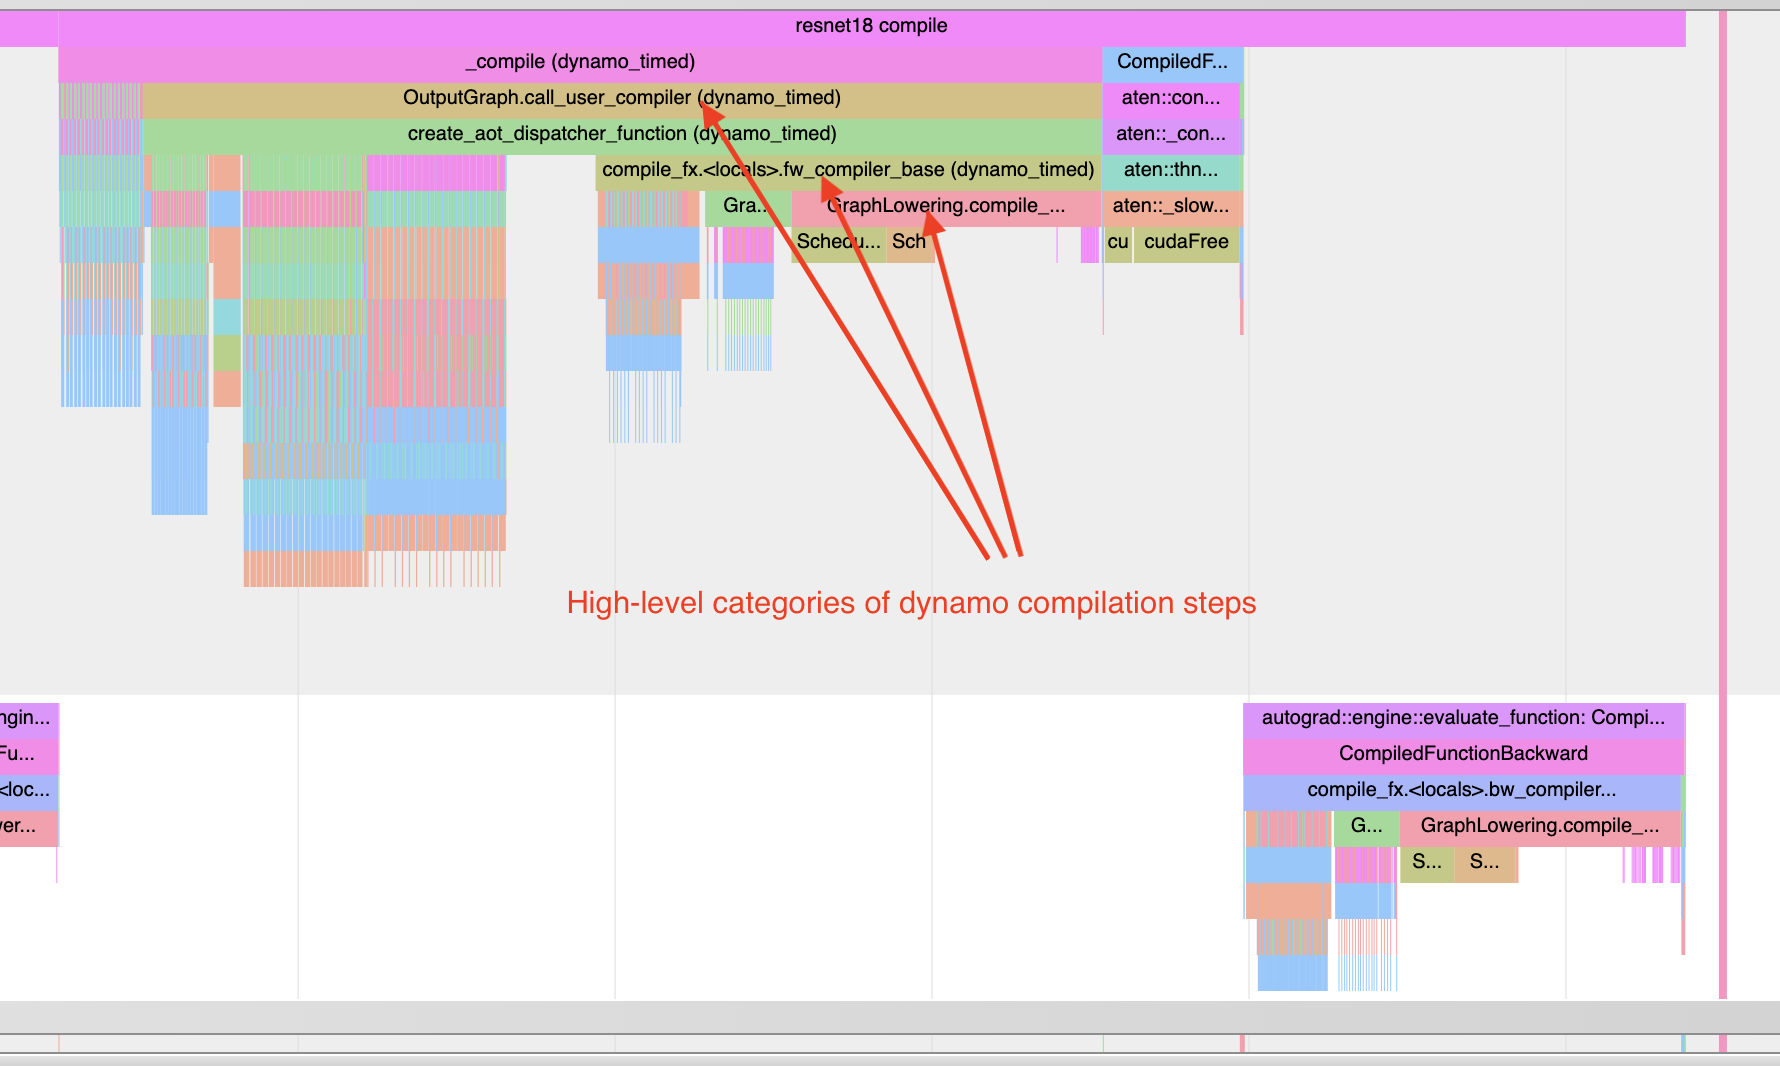
理解编译时间#
要了解编译为何耗时过长,可以分析 `torch.compile` 程序的第一次调用。请记住,对编译的分析 trace 可能比典型分析更易失真,因为编译工作负载可能与典型的 PyTorch 工作负载非常不同。在某些情况下,trace 文件也可能非常大。大于 1GB 的 trace 文件可能难以使用 chrome tracing 工具打开。
注意:使用 :code:torch._dynamo.utils.compile_times() 也可以在非图形化格式下获得大致相同的信息。此实用程序不会显示编译步骤发生的时间,但会显示每个步骤花费的时间——并且时间不会受到任何分析开销的影响。
下面看一个例子
    import torch
    from torchvision.models import resnet18

    # user can switch between cuda and xpu
    device = 'cuda'
    model = resnet18().to(device)
    inputs = [torch.randn((5, 3, 224, 224), device=device) for _ in range(10)]

    model_c = torch.compile(model)

    def fwd_bwd(inp):
        out = model_c(inp)
        out.sum().backward()

    def warmup_compile():
        def fn(x):
            return x.sin().relu()

        x = torch.rand((2, 2), device=device, requires_grad=True)
        fn_c = torch.compile(fn)
        out = fn_c(x)
        out.sum().backward()

    with torch.profiler.profile() as prof:
        with torch.profiler.record_function("warmup compile"):
            warmup_compile()

        with torch.profiler.record_function("resnet18 compile"):
            fwd_bwd(inputs[0])

    prof.export_chrome_trace("trace_compile.json")
注意几点:
第一次调用应该发生在分析 *期间* 以捕获编译。
添加预热编译以初始化任何需要惰性初始化的系统。
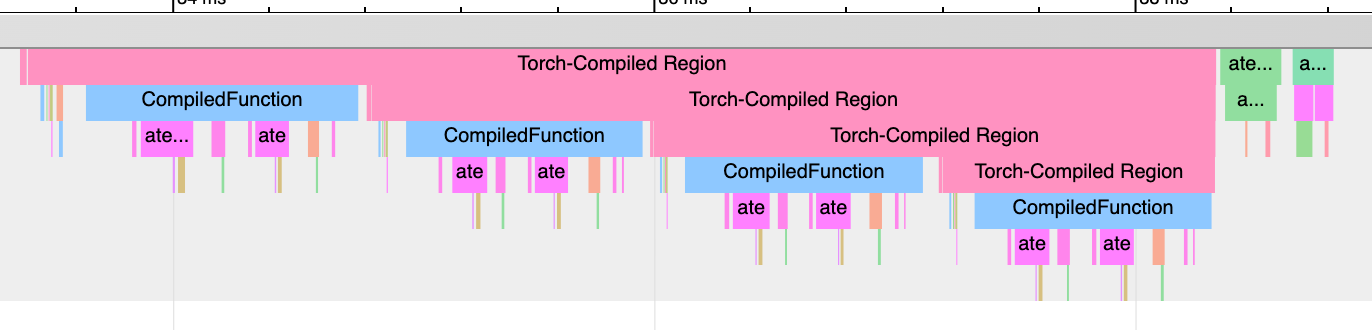
查找图中断:“Torch-Compiled Region”和“CompiledFunction”#
尽管有用于识别图中断的日志工具,但分析器提供了一种快速的视觉方法来识别 :ref:图中断 <torch.compiler_graph_breaks>。有两个分析器事件需要关注:**Torch-Compiled Region** 和 **CompiledFunction**。
**Torch-Compiled Region** —— 该事件在 PyTorch 2.2 中引入 —— 是一个覆盖整个编译区域的分析器事件。图中断几乎总是看起来相同:嵌套的“Torch-Compiled Region”事件。从 PyTorch 2.5 开始,分析器事件还将包含帧 ID 和帧编译 ID。帧 ID 是帧的唯一标识符,帧编译 ID 表示帧已被编译的次数。
如果您运行两个独立的函数,并且分别将 `torch.compile()` 应用于它们,通常应该会看到两个相邻(即*非*堆叠/嵌套)的 Torch-Compiled 区域。同时,如果您遇到图中断(或 `disable()`/跳过的区域),则会遇到嵌套的“Torch-Compiled Region”事件。
**CompiledFunction** —— 该事件在 PyTorch 2.0 中引入 —— 当对任何输入需要梯度时出现。每次图中断都会打断一个 CompiledFunction 块,将其分成两部分。CompiledFunction 事件仅在涉及 Autograd 时出现,即图的输入张量中至少有一个 `requires_grad=True`。
当 trace 中出现 CompiledFunction 事件时,它通常会与反向传播中的 CompiledFunctionBackward 事件配对。如果调用了反向函数,trace 中会出现一个“fwd-bwd link”连接两者。
如果您的用例包含一个不需要梯度的图,并且不包含“Torch-Compiled Region”事件,那么识别 `torch.compile` 是否正确应用可能会更加困难。一个线索是 Inductor 生成的 Triton 内核的存在。
请参阅下面的合成示例以进行演示。
    import torch
    import torch._dynamo
    # user can switch between cuda and xpu
    device = 'cuda'

    class ModelWithBreaks(torch.nn.Module):
        def __init__(self):
            super().__init__()
            def create_sequential():
                return torch.nn.Sequential(
                    torch.nn.Linear(128, 128),
                    torch.nn.ReLU(),
                    torch.nn.Linear(128, 128),
                    torch.nn.ReLU(),
                )
            self.mod1 = create_sequential()
            self.mod2 = create_sequential()
            self.mod3 = create_sequential()
            self.mod4 = create_sequential()

        def forward(self, inp):
            mod1 = self.mod1(inp)
            torch._dynamo.graph_break()
            mod2 = self.mod2(mod1)
            torch._dynamo.graph_break()
            mod3 = self.mod3(mod2)
            torch._dynamo.graph_break()
            mod4 = self.mod4(mod3)
            return mod4

    model = ModelWithBreaks().to(device)
    inputs = [torch.randn((128, 128), device=device) for _ in range(10)]

    model_c = torch.compile(model)

    def fwd_bwd(inp):
        out = model_c(inp)
        out.sum().backward()

    # warm up
    fwd_bwd(inputs[0])

    with torch.profiler.profile() as prof:
        for i in range(1, 4):
            fwd_bwd(inputs[i])
            prof.step()

    prof.export_chrome_trace("trace_break.json")
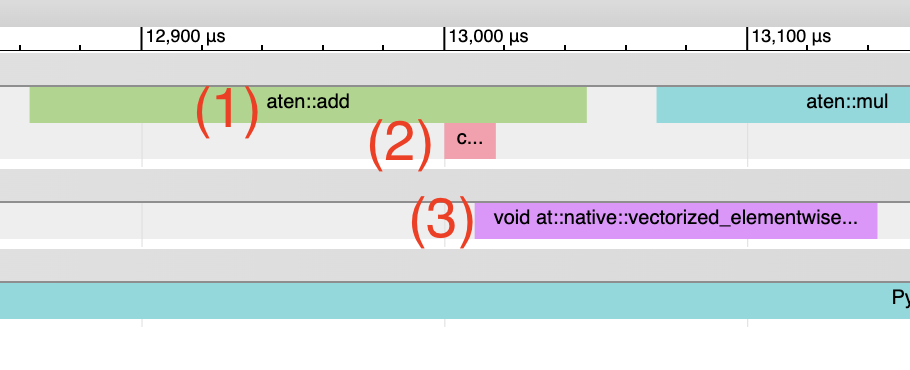
算子内核#
当启动一个算子时,我们期望看到几个事件:
CPU 端事件。
内核启动(如果处理的是 GPU 内核)。
GPU 端事件。
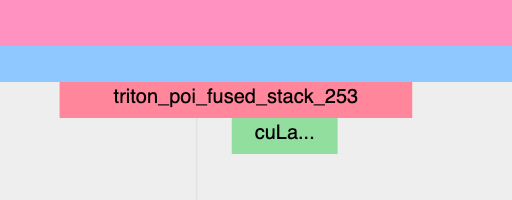
Inductor 生成的 Triton 内核。
**CPU 端事件**应显示为以“triton_”为前缀的事件。目前这些事件的信息量很少——只有内核名称和启动信息,但信息量少于典型的 aten 内核启动(其中包含输入形状、类型等)。
**内核启动**应显示为 `cuLaunchKernel` 而不是 `cudaLaunchKernel`(`cudaLaunchKernel` 对于 aten op 是典型的)。
**GPU 端事件**应显示出来,其名称的描述性程度取决于 `unique_kernel_names` 的 Inductor 配置。
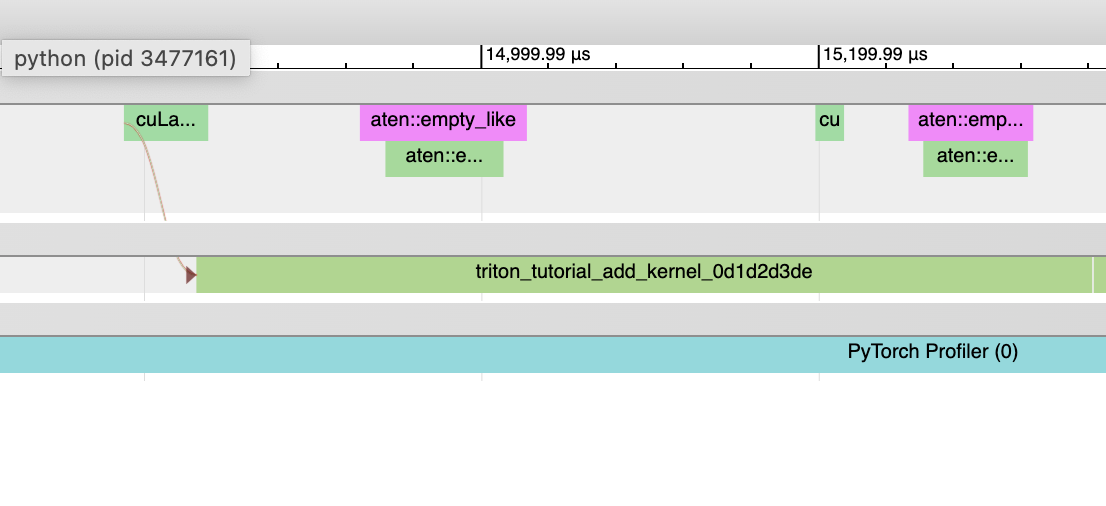
非 Inductor 生成的 Triton 内核。
**CPU 端**事件可能不会出现在 trace 中;自动插入分析器事件的机制目前在 Inductor 层面实现,因此绕过 Inductor 的 Triton 内核可能不会出现在 trace 中,除非用户手动进行了注解。
**内核启动**应显示为 `cuLaunchKernel` 而不是 `cudaLaunchKernel`(`cudaLaunchKernel` 对于 aten op 是典型的)。
**GPU 端**事件应显示出来,其名称与编写的 triton 内核类似。
Inductor 生成的 CPU 内核。
**CPU 端事件**不会出现在 trace 中;我们尚未为此添加分析。
**内核启动**和**GPU 端事件**不存在。
**非 Triton 内核**(即 aten 内核或自定义 op)也可能偶尔出现在 trace 中。有时,Inductor 会回退到原始 op 实现,在这种情况下,您会看到对 aten op 的调用。
启动开销#
一个常见的问题是 GPU 利用率不高。快速识别此问题的方法是检查 GPU 上内核之间是否存在大间隙。
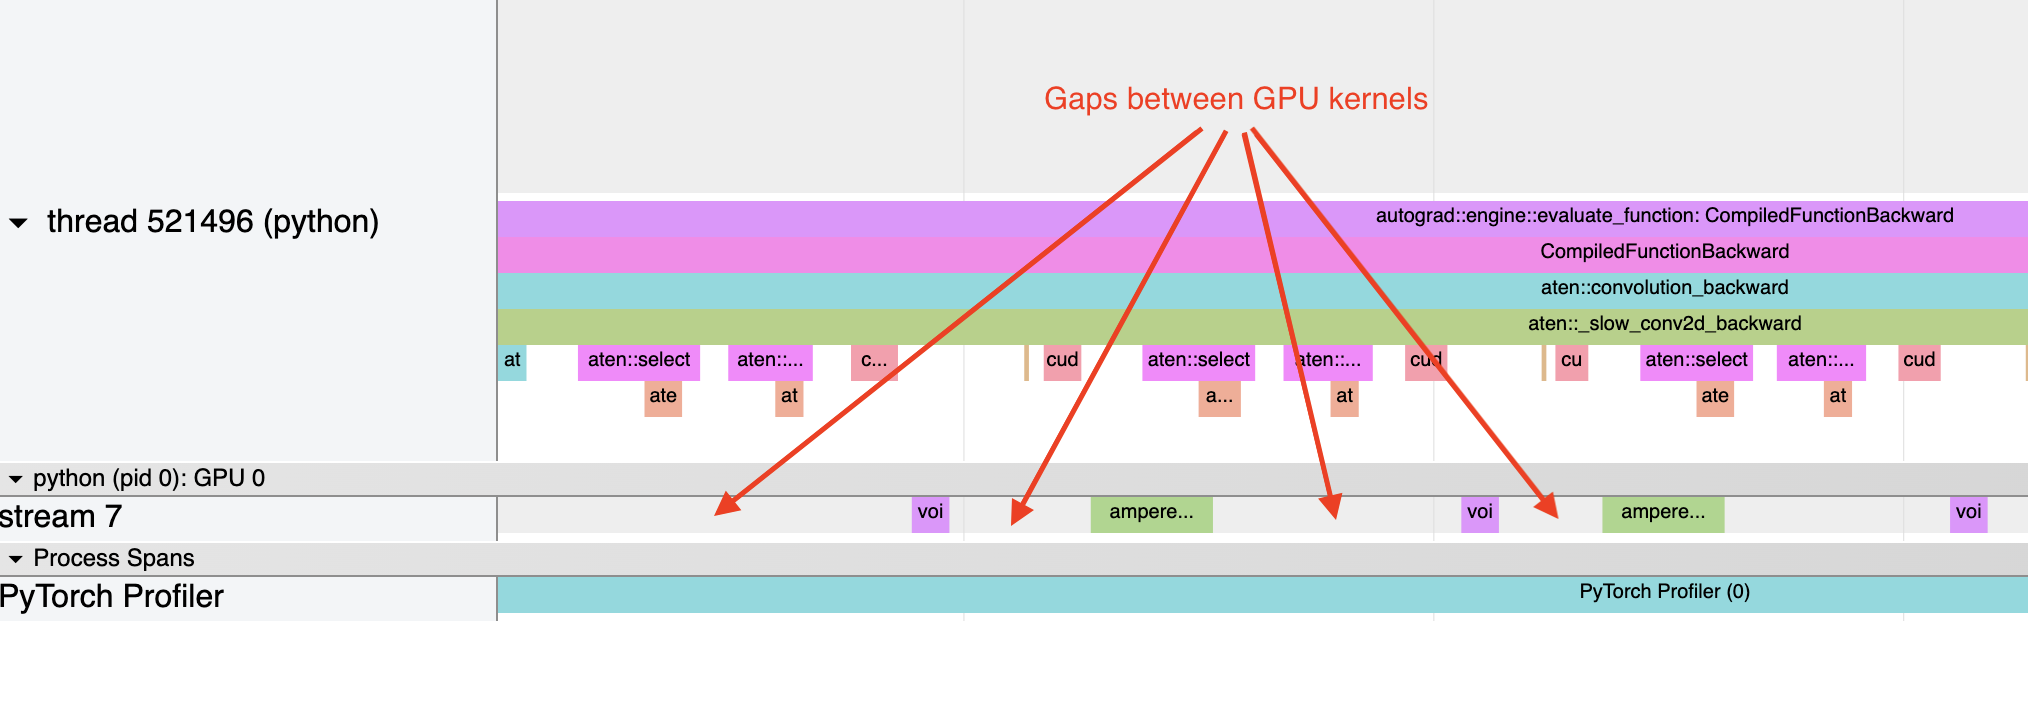
这通常是 CPU 开销的结果,例如,如果内核启动之间在 CPU 上花费的时间大于 GPU 处理内核所需的时间。对于小批量大小,这个问题更常见。
在使用 Inductor 时,启用 CUDA 图通常有助于在启动开销是问题时提高性能。
