理解 CUDA 内存使用#
创建于:2023年8月23日 | 最后更新于:2025年9月2日
为了调试 CUDA 内存使用,PyTorch 提供了一种生成内存快照的方法,该方法可以在任何时间点记录已分配 CUDA 内存的状态,并可选择记录导致该快照的分配事件历史。
生成的快照可以拖放到托管在 pytorch.org/memory_viz 上的交互式查看器中,用于探索快照。
注意
本文档中描述的内存分析器和可视化工具仅能查看通过 PyTorch 分配器分配和管理的 CUDA 内存。直接从 CUDA API 分配的任何内存都将不会在 PyTorch 内存分析器中可见。
NCCL(用于 CUDA 设备上的分布式通信)是一个常见的库,它会分配一些对 PyTorch 内存分析器不可见的 GPU 内存。有关更多信息,请参阅 识别非 PyTorch 分配。
生成快照#
记录快照的常用模式是启用内存历史记录,运行要观察的代码,然后将一个带有序列化快照的文件保存下来。
# enable memory history, which will
# add tracebacks and event history to snapshots
torch.cuda.memory._record_memory_history()

run_your_code()
torch.cuda.memory._dump_snapshot("my_snapshot.pickle")
使用可视化工具#
打开 https://pytorch.ac.cn/memory_viz,并将序列化的快照文件拖放到可视化工具中。该可视化工具是一个在您本地计算机上运行的 JavaScript 应用程序。它不会上传任何快照数据。
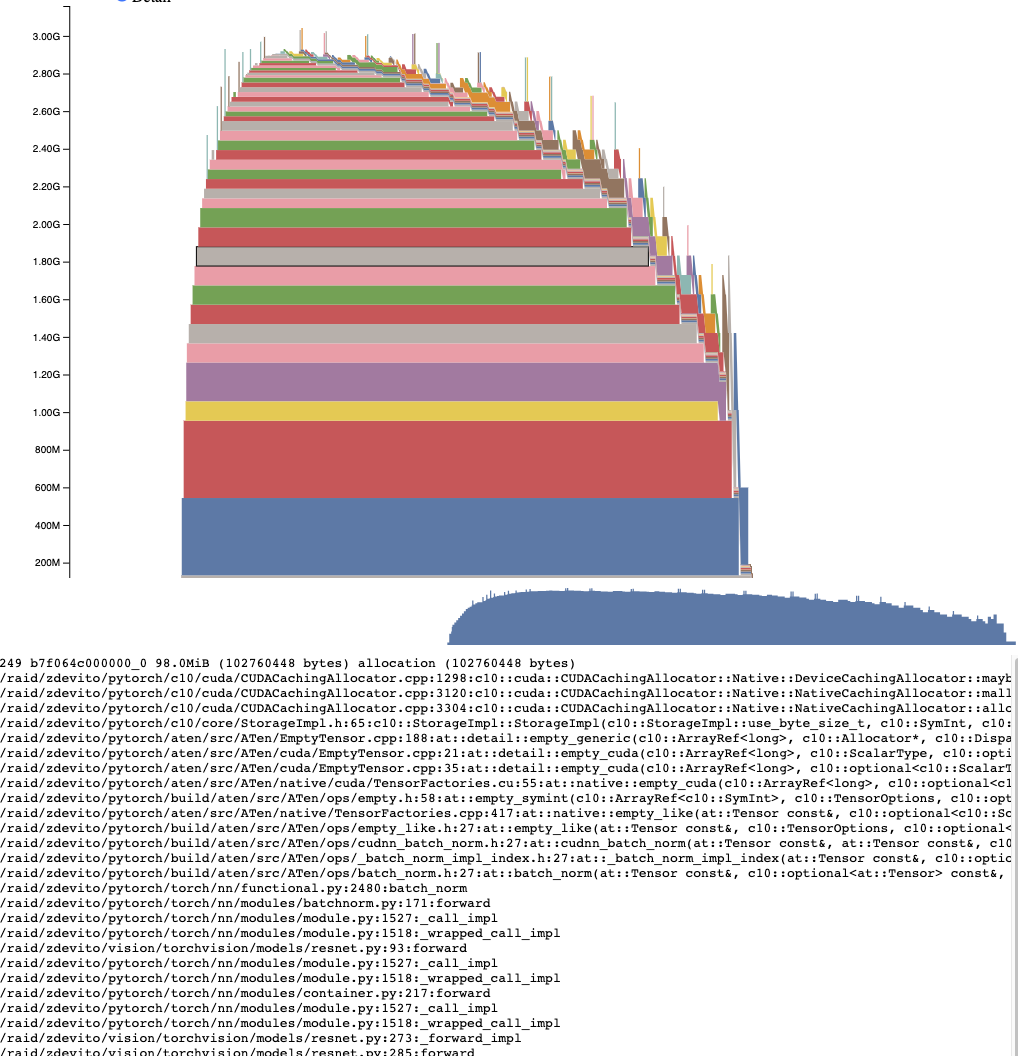
活动内存时间线#
活动内存时间线显示了快照中特定 GPU 上随时间推移的所有活动张量。可以通过平移/缩放图表来查看较小的分配。将鼠标悬停在已分配的块上,可以查看该块分配时的时间堆栈跟踪,以及其地址等详细信息。可以通过调整详细信息滑块来渲染更少的分配,从而在数据量很大时提高性能。
分配器状态历史#
分配器状态历史在左侧的时间线上显示了单个分配器事件。选择时间线中的一个事件,即可看到该事件时分配器状态的可视化摘要。此摘要显示了从 cudaMalloc 返回的每个单独的段,以及它如何被分割成单独的分配块或空闲空间。将鼠标悬停在段和块上,可以看到内存分配时的时间堆栈跟踪。将鼠标悬停在事件上,可以看到事件发生时的时间堆栈跟踪,例如张量被释放时。内存不足错误会报告为 OOM 事件。查看 OOM 期间的内存状态可能会提供有关为什么尽管仍有预留内存但分配失败的洞察。
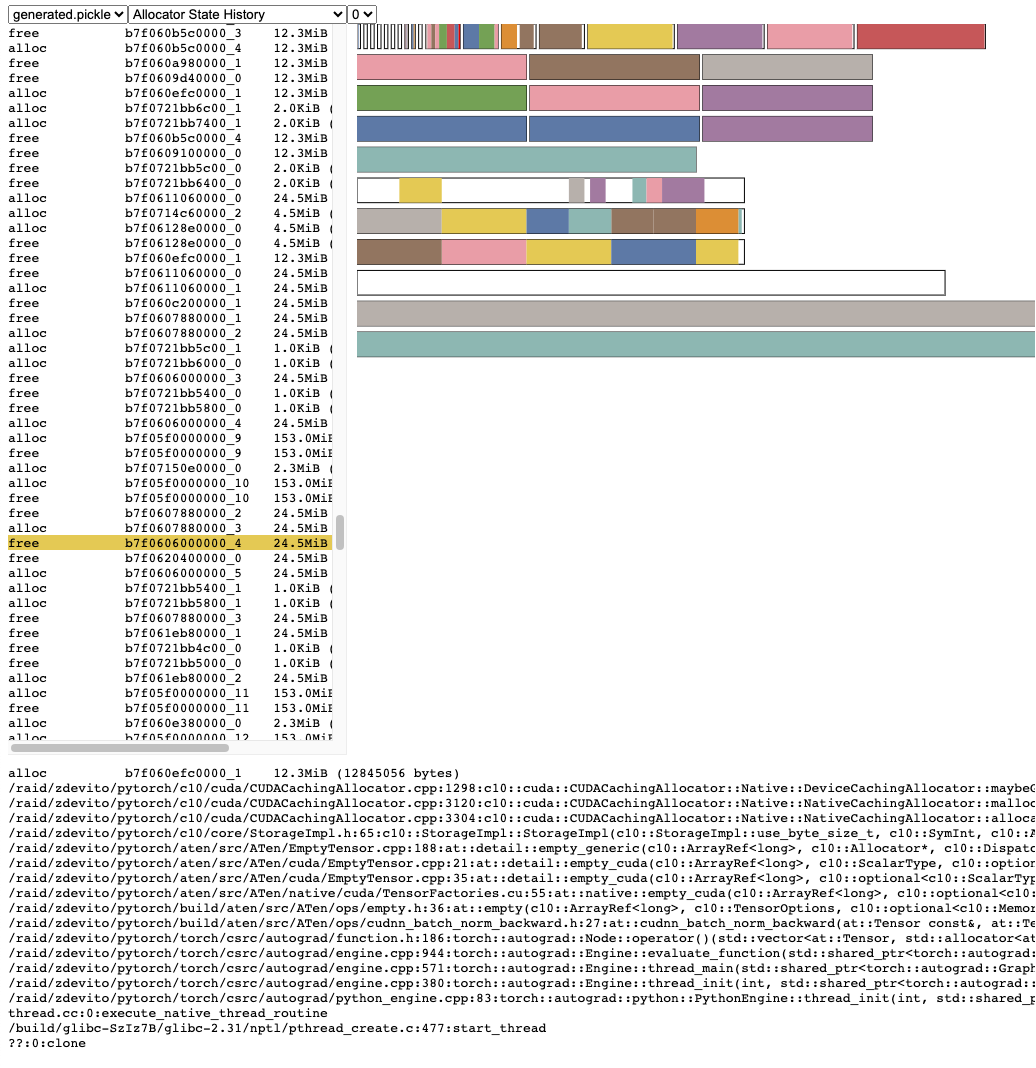
时间堆栈跟踪信息还报告了分配发生的地址。地址 b7f064c000000_0 指的是地址 7f064c000000 处的(块),这是该地址被分配的“_0”次。可以在活动内存时间线中查找此唯一字符串,并在活动状态历史中搜索,以检查张量分配或释放时的内存状态。
识别非 PyTorch 分配#
如果您怀疑 CUDA 内存是在 PyTorch 之外分配的,您可以使用 pynvml 包收集原始 CUDA 分配信息,并将其与 pytorch 报告的分配进行比较。
要收集 PyTorch 外部的原始内存使用情况,请使用 device_memory_used()
import torch
device_idx = ...
print(torch.cuda.device_memory_used(device_idx))
快照 API 参考#
- torch.cuda.memory._record_memory_history(enabled='all', context='all', stacks='all', max_entries=9223372036854775807, device=None, clear_history=False, compile_context=False, global_record_annotations=False)[source]#
启用内存分配相关的时间堆栈跟踪记录,以便您能够弄清楚
torch.cuda.memory._snapshot()中的任何内存块是如何分配的。除了为当前分配的内存和释放的内存保留时间堆栈跟踪外,此函数还将启用对所有分配/释放事件历史记录的记录。
使用
torch.cuda.memory._snapshot()来检索此信息,并使用 _memory_viz.py 中的工具来可视化快照。缓冲区行为#
启用后,将存储最多 max_entries 个 TraceEntry 实例。Python 跟踪收集默认为 sys.maxsize,这意味着长时间运行或无限期运行的作业应设置合理的限制,以避免过多的内存使用。每个条目预计占用几 KB。
运行时间更长的工作流程或 max_entries 值较小的工作流程将仅存储最后累积的 max_entries 个条目,这意味着新条目会覆盖旧条目。
C++ 实现,供参考环形缓冲区实现
if (record_history) {
  if (alloc_trace->size() < alloc_trace_max_entries_) {
    alloc_trace->emplace_back(te);
  } else {
    (*alloc_trace)[alloc_trace_next++] = te;
    if (alloc_trace_next == alloc_trace_max_entries_) {
      alloc_trace_next = 0;
    }
  }
}
延迟影响#
Python 跟踪收集速度很快(每个跟踪 2us),因此如果您预计将来需要调试内存问题,可以考虑在生产作业中启用此功能。
C++ 跟踪收集速度也很快(约 50ns/帧),对于许多典型程序来说,这相当于每个跟踪约 2us,但可能会因堆栈深度而异。
- 参数 enabled
None,禁用内存历史记录。 “state”,保留当前已分配内存的信息。 “all”,另外保留所有分配/释放调用的历史记录。默认为“all”。
- 参数类型 enabled
Literal[None, “state”, “all”], optional
- 参数 context
None,不记录任何回溯。 “state”,记录当前已分配内存的回溯。 “alloc”,另外保留分配调用的回溯。 “all”,另外保留释放调用的回溯。默认为“all”。
- 参数类型 context
Literal[None, “state”, “alloc”, “all”], optional
- 参数 stacks
“python”,包括 Python、TorchScript 和 Inductor 帧的回溯 “all”,另外包括 C++ 帧。默认为“all”。
- 参数类型 stacks
Literal[“python”, “all”], optional
- 参数 max_entries
在记录的历史记录中保留最多 max_entries 个分配/释放事件。
- 参数类型 max_entries
int, optional
- torch.cuda.memory._snapshot(device=None)[source]#
在调用时保存 CUDA 内存状态的快照。
状态表示为具有以下结构的字典。
class Snapshot(TypedDict):
    segments: List[Segment]
    device_traces: List[List[TraceEntry]]


class Segment(TypedDict):
    # Segments are memory returned from a cudaMalloc call.
    # The size of reserved memory is the sum of all Segments.
    # Segments are cached and reused for future allocations.
    # If the reuse is smaller than the segment, the segment
    # is split into more then one Block.
    # empty_cache() frees Segments that are entirely inactive.
    address: int
    total_size: int  #  cudaMalloc'd size of segment
    stream: int
    segment_type: Literal["small", "large"]  # 'large' (>1MB)
    allocated_size: int  # size of memory in use
    active_size: int  # size of memory in use or in active_awaiting_free state
    blocks: List[Block]


class Block(TypedDict):
    # A piece of memory returned from the allocator, or
    # current cached but inactive.
    size: int
    requested_size: int  # size requested during malloc, may be smaller than
    # size due to rounding
    address: int
    state: Literal[
        "active_allocated",  # used by a tensor
        "active_awaiting_free",  # waiting for another stream to finish using
        # this, then it will become free
        "inactive",
    ]  # free for reuse
    frames: List[Frame]  # stack trace from where the allocation occurred


class Frame(TypedDict):
    filename: str
    line: int
    name: str


class TraceEntry(TypedDict):
    # When `torch.cuda.memory._record_memory_history()` is enabled,
    # the snapshot will contain TraceEntry objects that record each
    # action the allocator took.
    action: Literal[
        "alloc"  # memory allocated
        "free_requested",  # the allocated received a call to free memory
        "free_completed",  # the memory that was requested to be freed is now
        # able to be used in future allocation calls
        "segment_alloc",  # the caching allocator ask cudaMalloc for more memory
        # and added it as a segment in its cache
        "segment_free",  # the caching allocator called cudaFree to return memory
        # to cuda possibly trying free up memory to
        # allocate more segments or because empty_caches was called
        "oom",  # the allocator threw an OOM exception. 'size' is
        # the requested number of bytes that did not succeed
        "snapshot",  # the allocator generated a memory snapshot
        # useful to coorelate a previously taken
        # snapshot with this trace
    ]
    addr: int  # not present for OOM
    frames: List[Frame]
    size: int
    stream: int
    device_free: int  # only present for OOM, the amount of
    # memory cuda still reports to be free
- 返回
快照字典对象
- torch.cuda.memory._dump_snapshot(filename='dump_snapshot.pickle')[source]#
将 torch.memory._snapshot() 字典的序列化版本保存到文件中。
此文件可以被 pytorch.org/memory_viz 上的交互式快照查看器打开。
快照文件大小与 max_entries 和每个条目的时间堆栈跟踪深度成比例,每个条目为几 KB。对于具有较大 max_entries 的长时间运行工作流程,这些文件很容易达到 GB 级别。
- 参数
filename (str, optional) – 要创建的文件名。默认为“dump_snapshot.pickle”。
